O
pen
A
rchive
T
OULOUSE
A
rchive
O
uverte (
OATAO
)
OATAO is an open access repository that collects the work of Toulouse researchers and
makes it freely available over the web where possible.
This is an author-deposited version published in :
http://oatao.univ-toulouse.fr/
Eprints ID : 11911
To link to this article :
DOI:10.1039/c3ce42588f
URL :
http://dx.doi.org/10.1039/c3ce42588f
To cite this version :
Bui, T. M. A. and Le Trong, Hoa and Presmanes, Lionel and
Barnabé, Antoine and Bonningue, Corine and Tailhades, Philippe
Thin films of Co1.7Fe1.3O4 prepared by radio frequency sputtering
- the first step towards their spinodal decomposition. (2014)
CrystEngComm (n° 16). pp. 3359-3365. ISSN 1466-8033
Any correspondance concerning this service should be sent to the repository
administrator:
[email protected]
Thin films of Co
1.7
Fe
1.3
O
4
prepared by radio
frequency sputtering
– the first step towards
their spinodal decomposition
T. M. A. Bui,
abdH. Le Trong,
abcL. Presmanes,
abA. Barnabé,
abC. Bonningue
aband P. Tailhades*
abPure thin films of Co1.7Fe1.3O4spinel iron cobaltites were prepared for the first time by radio frequency
sputtering. Such films are made of small crystallites of about 20 to 30 nm in diameter. Because Co1.7Fe1.3O4films have a composition located in the miscibility gap of Fe3O4–Co3O4, they can be submitted
to spinodal transformation below about 900°C. This transformation was also confirmed at 600 °C by X-ray diffraction and transmission electron microscopy studies. It was demonstrated however that this spinodal transformation occurs after only a few hours at low temperature. Indeed, after annealing in air at 300 to 450°C for a few hours, the spinodal transformation leading to two-phase spinels, one rich in iron and the other rich in cobalt, was clearly revealed by Raman spectroscopy and electrical measurements.
Introduction
Inside a miscibility gap of a phase diagram, a homogeneous solid solution is not stable. It is progressively broken down into two different phases either by nucleation and growth or spinodal decomposition.1The first process can occur in the whole composition range of the miscibility gap and generally leads to random microstructures. The second one, which only operates in a limited area of the gap, can induce periodic microstructures at a submicronic scale. Such microstructures are particularly interesting when they contain at least a magnetic ordered phase. Giant magnetoresistance was thus observed in ferromagnetic alloys obtained from spinodal decomposition.2–4Other collective properties could be obtained and are used to make, for instance, magnonic crystals, the magnetic counterpart of photonic crystals.5,6 The study of spinodal decomposition of magnetically ordered phases could then be a key step in the quest for materials with original properties, which are likely to find new technological applications.
In the CoFe2O4–Co3O4phase diagram,7–11there is a
misci-bility gap in which spinodal decomposition can lead to regular alternation of ordered magnetic phases made of iron-rich and
cobalt-rich spinel oxides. However, this was mainly observed in powders.9,13 Two studies were about the preparation of thin films of iron cobaltites in this range of composition and the related spinodal decomposition.11,12 Such films were obtained by the sol–gel process after annealing carried out above 800 °C. In the context of potential future applications, it is however necessary to be able to prepare thin films and to induce in them spinodal decomposition at low temperatures. This work was then devoted to the preparation of thin films of iron cobaltites by radio frequency sputtering and to the study of the thermal behaviour of such films at moderate tempera-tures (<500 °C).
CoFe2O4–Co3O4phase diagrams have already been established
experimentally7–11or from thermodynamic calculations.14 These phase diagrams are very similar even if there are some dis-crepancies in the position and the area of the miscibility gap in which two spinel phases co-exist at the thermodynamic equilibrium. The global composition Co1.7Fe1.3O4 is however
close to the centreline of this region and to that of the more limited area, in which the spinodal decomposition appears. The composition Co1.7Fe1.3O4was then chosen for this work.
Experimental
Film preparation
Pure Co1.7Fe1.3O4was prepared by heating at 600°C for 2 hours
a mixed oxalic precursor precipitated in a hydro-alcoholic medium. After adding polyvinylic alcohol, the resulting powder was pressed inside a matrix 100 mm in diameter. The uniaxial pressure applied was 75 MPa. The green disc obtained was then slowly heated to eliminate the organic binder and then
aUniversité de Toulouse, UPS-INPT, Institut Carnot CIRIMAT, 118 route de Narbonne,
CEDEX 9, F-31062 Toulouse, France. E-mail: [email protected]; Fax: +33 5 61 55 61 63; Tel: +33 5 61 55 61 74
bCNRS, Institut Carnot CIRIMAT, CEDEX 9, F-31062 Toulouse, France cHo Chi Minh City University of Science, Vietnam National University,
227 Nguyen Van Cu Q5, 750000 Ho Chi Minh City, Vietnam
dUniversity of Transport and Communications, Lang Thuong, Dong Da,
sintered at 900 °C for 12 hours. The relative density of the ceramic target thus prepared was close to 60%.
Thin films were prepared by radio frequency (RF) sputtering of the previous ceramic target. The sputtering gas was pure argon and the apparatus was an Alcatel A450 equipped with a radio frequency-generator (13.56 MHz) device as well as a pumping system (a mechanical pump coupled with a turbo molecular pump) which reaches residual pressures down to 10−5Pa, a gas flow controller, a water cooled target holder and two water cooled sample holders. The films were deposited on silicon or glass substrates. Their thickness was 300 nm.
A residual vacuum close to 5× 10⁻⁵Pa was reached in the sputtering chamber before introducing the argon deposition gas. The target was sputtered for 20 hours at the beginning. The target was also sputtered for 10 minutes before each film deposition on the substrate. The sputtering conditions (RF power and argon pressure) have been optimized to obtain pure Co1.7Fe1.3O4spinel films.
Characterization
Structural characterization of films was performed at room temperature by grazing angle X-ray diffraction (α = 1°) using a Siemens D5000 diffractometer equipped with a Bruker Sol-X detector. In situ high-temperature XRD data were collected in the Bragg–Brentano θ–θ geometry using a Bruker D8 Advanced diffractometer equipped with an Anton Paar HTK 1200N heating chamber and a Bruker LynxEye position sensitive detector. XRD patterns were recorded under air every 50 °C from 50 to 900 °C with a data collection time of 20 min per scan and a 30°C min−1heating rate. The films used for these experiments were 300 nm thick and deposited on a pure silicon substrate because this material can withstand up to 900 °C despite low oxidation of the surface not covered by the cobaltite. The copper Kα X-ray radiation (Kα1 = 0.15405 nm and Kα2 =
0.15443 nm) was used for both diffractometers.
Imaging and elemental analyses were performed using a JEOL 2100F field emission gun transmission electron micro-scope (FE-TEM) operating at 200 kV and equipped with an X-ray energy dispersive spectroscopy (X-EDS) system. X-EDS chemical composition mapping was also performed in scan-ning TEM (STEM) mode. For the cross-section TEM and STEM observations, the thin films were deposited on a silicon substrate, cut into thin slices normal to the interfaces which were glued together between spacers and finally ion milled to perforation.
Raman spectra were collected under ambient conditions using a LabRAM HR 800 Jobin Yvon spectrometer with a 633 cm−1 Ar+ ion laser. Spectra acquisition was carried out for 400 seconds using a×100 objective lens and 600 g mm−1 grating. During the measurement, the resulting laser power at the surface of the sample was adjusted to 0.7 mW. Exami-nation of multiple spots showed that the samples were homogeneous. The substrate chosen was a quartz microscope slide able to be heated up to 600°C without damage. Unlike silicon, this substrate has no Raman signal in the spectral range analysed.
The magnetic properties were measured in the plane of the films using a vibrating sample magnetometer Versalab Free from Quantum Design. The maximal applied field for the measurements was 30 kOe. The magnetization of the samples was corrected for substrate contribution.
Film thicknesses were measured using a Dektak 3030ST mechanical profilometer. Atomic force microscopy (AFM) was carried out using a Veeco Dimension 3000 atomic force microscope. The microstructure of the samples was also investigated by scanning electron microscopy using a JEOL JSM 6700F apparatus.
Results and discussion
As-deposited films
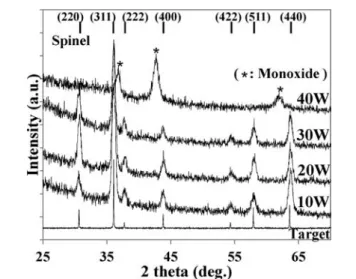
The nature of the phases obtained after RF sputtering depends on the preparation conditions. The RF power density has a strong influence, as revealed in Fig. 1. For a RF power close to 40 W and an argon pressure of 0.5 Pa, the film is made of mixed cobalt–iron monoxide. This phase seems pure because all of the diffraction peaks can be ascribed to the XRD pattern of cobalt–iron monoxide. Moreover, the magneti-zation (M) versus magnetic field (H) curves do not display hys-teresis that could reveal an extra ferrimagnetic spinel phase. When the RF power density is decreased, the X-ray diffraction pattern of a spinel phase replaces the previous pattern (Fig. 1). Some changes in the (220) peak intensity are observed for samples containing a little monoxide. These changes cannot be attributed to changes in cationic distributions because the very small differences in the electronic densities of the Co2+, Co3+and Fe3+ions cannot produce such large variations in the XRD peak intensity. The reason for these changes seems rather related to crystallite growth in a preferred direction.
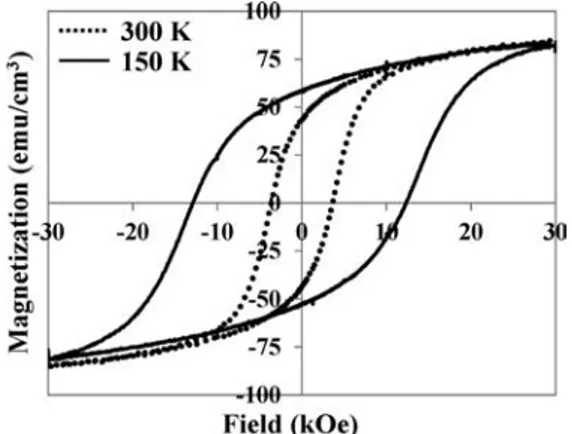
The M = f(H) curves are clearly hysteresis curves for these samples as shown in Fig. 2 for the film deposited at 20 W. The coercive force is very high at 150 K (close to 12 kOe) but decreases down to 3.6 kOe at room temperature. This
Fig. 1 X-ray diffraction patterns of films deposited at a 0.5 Pa argon pressure at different RF powers.
behaviour, due to high magnetocrystalline anisotropy strongly dependent on temperature, is similar to that observed by Takahashi and Fine.15Slightly lower magnetization at 30 kOe is observed for the film prepared at 30 W. This magnetization is only 72.8 emu cm−3, which is close to 82.6 and 86.4 emu cm−3 for the films prepared at 20 and 10 W, respectively. This could be explained by the presence of a small quantity of monoxide, which does not contribute as strongly to the magnetization of the film as the ferrimagnetic spinel phase.
Some experiments carried out at argon pressures increasing from 0.5 to 1.5 Pa show also that this modification of sputtering conditions leads to a decrease in magnetization measured at 30 kOe. Moreover, at higher argon pressures, the X-ray diffraction patterns reveal the formation of monoxide in addition to the spinel phase.
When the argon pressure and the RF power density were fixed at 0.5 Pa and 20 W, respectively, the films obtained display the X-ray diffraction pattern of a pure spinel phase and have high magnetization. They also display the same Raman spectrum as that of a pure Co1.7Fe1.3O4spinel powder
(Fig. 3). Similar results were obtained at 0.5 Pa and 10 W but the deposition rate is lower in this case. The sputtering con-ditions selected for the preparation of the samples studied in
the following section, dedicated to the study of the thermal stability of the films, were then 0.5 Pa and 20 W. The micro-structure of such films is made of well crystallized small columns of about 20 to 30 nm in diameter (Fig. 4). The Ra roughness of the films, measured by atomic force microscopy, is close to 2 nm.
Annealed films
As was pointed out in the Introduction, the CoxFe3−xO4
solid solutions acquired so far, at about 900 to 950 °C and then quenched to room temperature, are not stable in the miscibility gap (from RT to about 875 °C). The Co1.7Fe1.3O4
RF-sputtered films of this work were not treated at such tem-peratures because the sputtering process of oxides generally leads to temperatures lower than 200 °C on the substrate surface. However, due to thermodynamic reasons, they also have to be transformed in the miscibility gap even if different parameters, such as mechanical stress and crystallite size, could influence the mechanism and the speed of transforma-tion as observed for samples studied so far. Their thermal stability inside the miscibility gap was then carefully studied, mainly at quite low temperatures compatible with the use of ordinary glass substrates.
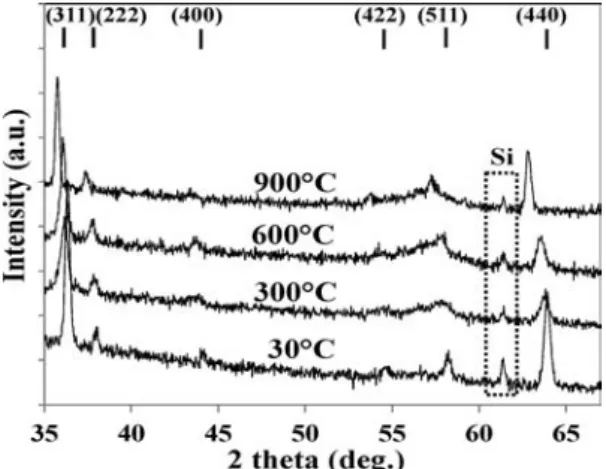
The first experiments were carried out in an X-ray diffrac-tometer equipped with a heating chamber. Fig. 5 shows that the peaks corresponding to the spinel structure are not clearly modified by these heating conditions apart from a slight shift of the Bragg position towards low 2 theta angles due to the thermal expansion. However, broadening of peaks is observed from the powder diffraction patterns recorded at 600 °C and higher temperatures. Some other diffractograms were recorded at 600°C for different durations (Fig. 6). Above about 5 hours of hold time, some peaks started to split (i.e. (440) for instance). This split indicates that the initial single phased film is transformed into two spinel phases. An iron-rich phase and another phase rich in cobalt, with crystal-line parameters respectively greater and smaller than the initial phase, grew progressively according to the characteris-tic process of the spinodal decomposition.11After cooling to
room temperature, the sample remained two-phased. Fig. 2 Hysteresis loops registered at 150 K and 300 K of films
deposited at 0.5 Pa and 20 W.
Fig. 3 Raman spectra of films deposited at 0.5 Pa and 20 W.
Fig. 4 Microstructure of films deposited at 0.5 Pa and 20 W: the AFM planar view (4a) and the SEM (4b) and TEM (4c) cross section views.
The structural changes of Co1.7Fe1.3O4 films were also
studied by Raman spectroscopy. The Co1.7Fe1.3O4film
depos-ited on the quartz was heated in a conventional furnace at 600 °C for increasing durations. Raman spectra revealed the main peaks related to the spinel oxides, already identified in previous studies.16–18 They are also changing with the duration of the heat treatment (Fig. 7). The main change, especially above 6 hours, is the very strong growth of the F2g(1) and A1g peaks. The emergence of low-intensity F2g(2)
and F2g(3) peaks must also be reported. X-ray diffraction
results show that the spinodal decomposition is only observed after more than 5 hours of treatment. This is in good accordance with XRD analysis results which show that the spinodal decomposition is only observed after more than 5 hours of treatment.
To understand such changes, it is interesting to have a look at the Raman spectra of cobalt-rich (Co2.46Fe0.54O4)
and iron-rich (Co1.22Fe1.78O4) spinel powders as reference
samples (Fig. 7).
These powders have chemical compositions very close to those (Co2.69Fe0.31O4 and Co1.16Fe1.84O4) obtained after
complete transformation of the Co1.7Fe1.3O4 cobaltite.19 In
other words, they have very similar compositions to those which limit the miscibility gap at low temperatures. The Raman spectra of these powders are quite different. Very well defined peaks of F2g(1) and A1g and, to a lesser extent,
F2g(1) are observed for the Co-rich phase. These can be
ascribed to a high content of Co2+ ions in tetrahedral sites (F2g(1) peak) and to a high content of Co3+ions in
octa-hedral sites (A1g peak). According to ref. 19 the structural
formula of the Co-rich phase is indeed:
Co12+[Co1.463+Fe0.543+]O42− (1)
(cations outside and inside the brackets are located in the tetrahedral and octahedral sites, respectively). By contrast, the small F2g(2) peak is characteristic of the iron-rich phase.
It is then clear that the superposition of such spectra leads to a spectrum similar to that observed after a long heat treat-ment of the Co1.7Fe1.3O4 film. The growth of the F2g(1) and
A1g peaks and the emergence of low-intensity F2g(2) and
F2g(3) peaks after heat treatments are so simply explained by
the formation of cobalt-rich and iron-rich phases.
According to previous results,19 the transformation of Co1.7Fe1.3O4powders by spinodal decomposition or nucleation
and growth does not lead to a strong difference in the average number of oxygen anions surrounding each cation in the spinel lattices of the material. The real change is that the cat-ions are located in two separated phases in such a manner that some cations are“concentrated” in a sub-lattice in a given spinel phase. For instance, the formation of a cobalt-rich phase, resulting from the spinodal transformation, concentrates 100% of Co2+ ions and 75% of Co3+ ions in its tetrahedral and Fig. 5 XRD patterns registered at different temperatures of films
deposited at 0.5 Pa and 20 W.
Fig. 6 XRD patterns registered at 600°C of films deposited at 0.5 Pa and 20 W on a silicon substrate.
Fig. 7 Raman spectra of films deposited at 0.5 Pa and 20 W and annealed at 600 °C for different annealing times compared with Raman spectra of Co1.22Fe1.78O4 (iron rich spinel) and Co2.46Fe0.54O4
octahedral sites, respectively (see formula (1)). The contribu-tion to the Raman spectra of such a phase, which is signifi-cantly different than the iron-rich phase in which the cobalt ions are “diluted” in the two sub-lattices, thus becomes clearly visible. Raman spectroscopy is then very sensitive to the formation of a new spinel phase very rich in cobalt ions.
No clear contrast between the two phases formed by spinodal transformation at 600°C for 24 hours was highlighted. Local chemical analyses were also unable to reveal the phases indi-vidually as shown by the homogeneous distribution of the iron and cobalt species in the cross section STEM view (Fig. 8a). A complete segregation occurs however after a much longer annealing time. For instance, a sample heat treated in air at 600°C for 96 hours clearly displays cobalt rich and iron rich regions of about 50 nm in diameter (Fig. 8b). The random distribution of the two phases in these regions along and per-pendicular to the columns reveals however that the spinodal transformation is replaced by a nucleation and growth process for such a very long time of treatment at 600°C.
In order to achieve spinodal decomposition at moderate temperature, annealing treatment at 450°C was also carried out. The annealing of the films at 450°C increases a little bit the average grain size. Indeed, atomic force microscopy reveals that the mean diameter of the grains changes from 30 to about 50 nm. After 24 hours of treatment at 450°C, there is no clear change in the X-ray diffraction patterns. A careful examination of the patterns shows however a very small peak broadening. This is in contradiction to the increase of the size of the grains. Coarser grains would suggest an improvement of crystallization, revealed by narrower diffraction peaks. The peak broadening could then reveal the beginning of the spinodal decomposition.
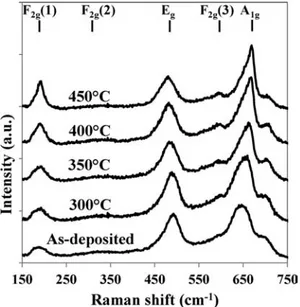
Raman spectroscopy is however more informative (Fig. 9). After only 5 minutes of treatment at 450 °C, the F2g(1)
and A1gpeaks as well as the F2g(3) peak grew significantly in
a manner similar to that observed for films decomposed at 600 °C. This growth continued for longer annealing times. It seems reasonable then to conclude that the spinodal decomposition starts a few minutes after the Co1.7Fe1.3O4 is
heated at 450°C, even if no clear change in the X-ray diffrac-tion patterns is observed. The changes observed through Raman spectroscopy could be the first step of spinodal decomposition already described by Harrison and Putnis20 which corresponds to the development of low-amplitude sinusoidal fluctuation of compositions. The gathering of cobalt ions in a small region could make its detection by Raman spectroscopy possible, but the gradual variation of the composition induced by this first step of the spinodal decomposition could make the characterization by X-ray dif-fraction difficult. Just a small peak broadening could be expected from this technique.
Treatments at temperatures even lower than 450 °C were also carried out. It was very surprising to see that after only 2 hours at 300 °C, the Raman spectra of Co1.7Fe1.3O4
films begin to resemble the shape of decomposed cobaltites spectra (Fig. 10). This evolution is obviously more pronounced for treatments at higher temperatures. Fig. 11 clearly illustrates the initiation of decomposition for mild heating and its progress for more energetic treatments. The F2g(1) peak intensity, normalized by that of the Eg peak,
which remains approximately constant along the treatments, grows regularly and significantly with the heating tempera-ture and time.
Electron exchanges between Mn+ and M(n+1)+ cations located in the same sub-lattice induce semi-conducting properties in spinel oxides.21 Co1.7Fe1.3O4 is thus a
semi-conductor because its structural formula is close to
Co0.612+Fe0.393+[Co0.392+Co0.733+Fe0.883+]O42− (2)
according to ref 19. However, due to the high activation energy of the electronic exchange for the Co2+/Co3+ couples,22,23 the electrical resistivity of such a material is quite high at room temperature but decreases strongly at higher temperatures. The electrical resistivities of the as-sputtered and heat treated Co1.7Fe1.3O4samples were then studied at 250°C, to make the
Fig. 8 Cross section STEM micrographs and corresponding EDS maps obtained using iron (red) and cobalt (blue) Kα of the films annealed at 600°C for 24 h (a) and 96 h (b).
Fig. 9 Raman spectra of films deposited at 0.5 Pa and 20 W and annealed several times at 450°C.
measurements possible in our experimental set-up. A quite high activation energy, close to 0.48 eV, was measured in agreement with the bibliographic data.22,23 On the other hand, Fig. 12 shows that the resistivity of the films increases almost linearly with the time of annealing at 450 °C. This clearly demonstrates significant changes in the material at this moderate temperature of treatment. According to ref. 19 at the end of the transformation of Co1.7Fe1.3O4 in the
misci-bility gap, the cobalt-rich phase formed is an insulator because it has no more Co2+ and Co3+ ions on the same sub-lattice. The iron-rich phase (Co1.16Fe1.84O4), which is also
created, is however a semiconductor. However, its structural formula is close to
Co0.302+Fe0.703+[Co0.702+Co1.163+Fe1.143+]O42− (3)
which shows that the number of Co2+/Co3+couples is much lower than that of the initial single phase Co1.7Fe1.3O4
(see structural formula (2)). The spinodal decomposition of the latter necessarily leads to a progressive increase in resistivity. This is in agreement with the results of the electrical measurements shown in Fig. 12. The combination of the results coming from Raman spectroscopy and electrical measure-ments then seems to prove the beginning of the spinodal transformation, after heat treatments at very moderate tem-peratures for quite a short time of annealing.
Conclusion
Thin films of Co1.7Fe1.3O4 were prepared for the first
time by RF sputtering on a substrate at room temperature. Pure as-deposited samples are made of small crystallites of about a few tens of nanometers. Because they have a compo-sition inside the miscibility gap of the phase diagram of CoFe2O4–Co3O4, their thermal stability was studied. It was
shown that RF sputtered Co1.7Fe1.3O4films are not stable at
600°C as for cobaltites of a similar composition already pre-pared at high temperature. More original results were obtained however. It was demonstrated using mainly Raman spectroscopy and electrical measurements that Co1.7Fe1.3O4
films can be partially transformed at quite low temperatures, ranging from 300 to 450 °C, and after quite a short time of annealing. This partial transformation is a first step of spinodal decomposition. From the present work it can then be concluded that the preparation of thin films structured by spinodal transformation could be obtained at temperatures Fig. 10 Raman spectra of films deposited at 0.5 Pa and 20 W and
annealed for 2 h at different temperatures.
Fig. 11 The evolution of the F2g(1) Raman peak relative intensity
of films deposited at 0.5 Pa and 20 Wversus annealing temperature and time.
Fig. 12 Electrical measurements at 250°C of films deposited at 0.5 Pa and 20 W and annealed at 450°C for different durations.
compatible with the use of cheap substrates such as conven-tional glass slides or silicon wafers.
Acknowledgements
Thi Mai Anh Bui wishes to thank the Vietnamese Government Scholarship (project 322) of the Vietnam Ministry of Education and Training and the support of Carnot Institute CIRIMAT for her PhD grant.
Notes and references
1 J. W. Cahn and J. E. Hilliard, J. Chem. Phys., 1958, 28, 258–267. 2 M. G. M. Miranda, E. Esteves-Rams, G. Martinez and M. N. Baibich, Phys. Rev. B: Condens. Matter Mater. Phys., 2003, 68, 01443.
3 M. G. M. Miranda, A. T. da Rosa, R. Hinrichs, U. Golla-Schindler, A. B. Antunes, G. Martinez, E. Esteves-Rams and M. N. Baibich, Phys. B, 2006, 384, 175–178.
4 A. Hutten, D. Sudfeld, K. Wojcrykowski, P. Jutzi and G. Reiss, J. Magn. Magn. Mater., 2003, 262, 23–31.
5 S. A. Nikitov, P. Tailhades and C. S. Tsai, J. Magn. Magn. Mater., 2001, 236, 320–330.
6 Y. V. Gulyaev, S. A. Nikitov, L. V. Zhivotovskii, A. A. Klimov, P. Tailhades, L. Presmanes, C. Bonningue, C. S. Tsai, S. L. Vysotskii and Y. A. Filimonov, JETP Lett., 2003, 77, 567–570.
7 J. Robin, Ann. Chim, 1955, 10, 389–412.
8 M. Takahashi and M. E. Fine, J. Am. Ceram. Soc., 1970, 53, 633–634.
9 M. Takahashi, J. R. C. Guimares and M. E Fine, J. Am. Ceram. Soc., 1971, 54, 291–295.
10 P. J. Murray and J. W. Linnett, J. Phys. Chem. Solids, 1976, 37, 619–624.
11 S. Hirano, T. Yogo, K. Kikuta, E. Asai, K. Sugiyama and H. Yamamoto, J. Am. Ceram. Soc., 1993, 76, 1788–1792. 12 K. J. Kim, J. H. Lee and C. S Kim, J. Korean Phys. Soc., 2012,
61, 1274–1278.
13 H. Le Trong, A. Barnabé, L. Presmanes and P. Tailhades, Solid State Sci., 2008, 10, 550–556.
14 I.-H. Jung, S. Decterov, A. D. Pelton, H.-M. Kim and Y.-B. Kang, Acta Mater., 2004, 52, 507–519.
15 M. Takahashi and M. E. Fine, J. Appl. Phys., 1972,43, 4205–4216. 16 H. Shirai, Y. Morioka and I. Nakagawa, J. Phys. Soc. Jpn.,
1982, 51, 592–597.
17 V. G Hadjiev, M. N. Iliev and I. V. Vergilov, J. Phys. Chem., 1988, 21, 199–201.
18 P. Chandramohan, M. P. Srinivasan, S. Velmurugan and S. V. Narashimhan, J. Solid State Chem., 2011, 184, 89–96. 19 H. Le Trong, L. Presmanes, E. De Grave, A. Barnabé,
C. Bonningue and P. Tailhades, J. Magn. Magn. Mater., 2013, 334, 66–73.
20 R. J. Harrison and A. Putnis, Surveys in Geophysics, 1999, 19, 461–520.
21 E. J. W. Verwey and P. W. Haayman, Phys. A, 1941, 8, 979–987. 22 G. H. Jonker, J. Phys. Chem. Solids, 1959, 9, 165.
23 P. A. Cox, Electronic structure and chemistry of solids, Oxford Science Publications, 1987, p. 184.