Any correspondence concerning this service should be sent
to the repository administrator: tech-oatao@listes-diff.inp-toulouse.fr
This is an author’s version published in:
http://oatao.univ-toulouse.fr/22674
Official URL
http://oaei.ontologymatching.org/2014/results/oaei2014.pdf
Open Archive Toulouse Archive Ouverte
OATAO is an open access repository that collects the work of Toulouse
researchers and makes it freely available over the web where possible
To cite this version:
Dragisic, Zlatan and Eckert, Kai and Euzenat,
Jérôme and Faria, Daniel and Ferrara, Alfio and Granada, Roger and
Ivanova, Valentina and Jiménez-Ruiz, Ernesto and Kempf, Andreas and
Lambrix, Patrick and Montanelli, Stefano and Paulheim, Heiko and Ritze,
Dominique and Shvaiko, Pavel and Solimando, Alessandro and Trojahn,
Cassia and Zamazal, Ondrej and Cuenca Grau, Bernardo Results of the
Ontology Alignment Evaluation Initiative 2014. (2014) In: 11th
International Workshop on Ontology Matching co-located with the 13th
ISWC (OM 2014), 20 October 2014 (Riva del Garda, Italy).
Results of the
Ontology Alignment Evaluation Initiative 2014
⋆Zlatan Dragisic2 , Kai Eckert3 , J´erˆome Euzenat4 , Daniel Faria12 , Alfio Ferrara5
, Roger Granada6,7, Valentina Ivanova2
, Ernesto Jim´enez-Ruiz1
,
Andreas Oskar Kempf8
, Patrick Lambrix2
, Stefano Montanelli5
, Heiko Paulheim3
,
Dominique Ritze3, Pavel Shvaiko9, Alessandro Solimando11,
C´assia Trojahn7
, Ondˇrej Zamazal10
, and Bernardo Cuenca Grau1
1 University of Oxford, UK
{berg,ernesto}@cs.ox.ac.uk
2 Link¨oping University & Swedish e-Science Research Center, Link¨oping, Sweden
{zlatan.dragisic,valentina.ivanova,patrick.lambrix}@liu.se
3 University of Mannheim, Mannheim, Germany
{kai,heiko,dominique}@informatik.uni-mannheim.de
4 INRIA & Univ. Grenoble-Alpes, Grenoble, France
Jerome.Euzenat@inria.fr
5 Universit`a degli studi di Milano, Italy
{alfio.ferrara,stefano.montanelli}@unimi.it
6 Pontif´ıcia Universidade Cat´olica do Rio Grande do Sul, Porto Alegre, Brazil
roger.granada@acad.pucrs.br
7 IRIT & Universit´e Toulouse II, Toulouse, France
cassia.trojahn@irit.fr
8 GESIS – Leibniz Institute for the Social Sciences, Cologne, Germany
andreas.kempf@gesis.org
9 TasLab, Informatica Trentina, Trento, Italy
pavel.shvaiko@infotn.it
10 University of Economics, Prague, Czech Republic
ondrej.zamazal@vse.cz
11 DIBRIS, University of Genova, Italy
alessandro.solimando@unige.it
12 LASIGE, Faculdade de Ciˆencias, Universidade de Lisboa, Portugal
dfaria@xldb.di.fc.ul.pt
Abstract. Ontology matching consists of finding correspondences between se-mantically related entities of two ontologies. OAEI campaigns aim at comparing ontology matching systems on precisely defined test cases. These test cases can use ontologies of different nature (from simple thesauri to expressive OWL on-tologies) and use different modalities, e.g., blind evaluation, open evaluation and consensus. OAEI 2014 offered 7 tracks with 9 test cases followed by 14 partici-pants. Since 2010, the campaign has been using a new evaluation modality which provides more automation to the evaluation. This paper is an overall presentation of the OAEI 2014 campaign.
1
Introduction
The Ontology Alignment Evaluation Initiative1 (OAEI) is a coordinated international
initiative, which organizes the evaluation of the increasing number of ontology match-ing systems [12, 15]. The main goal of OAEI is to compare systems and algorithms on the same basis and to allow anyone for drawing conclusions about the best matching strategies. Our ambition is that, from such evaluations, tool developers can improve their systems.
Two first events were organized in 2004:(i) the Information Interpretation and
In-tegration Conference (I3CON) held at the NIST Performance Metrics for Intelligent
Systems (PerMIS) workshop and(ii) the Ontology Alignment Contest held at the
Eval-uation of Ontology-based Tools (EON) workshop of the annual International Seman-tic Web Conference (ISWC) [34]. Then, a unique OAEI campaign occurred in 2005 at the workshop on Integrating Ontologies held in conjunction with the International Conference on Knowledge Capture (K-Cap) [2]. Starting from 2006 through 2013 the OAEI campaigns were held at the Ontology Matching workshops collocated with ISWC [13, 11, 4, 8–10, 1, 6]. In 2014, the OAEI results were presented again at the Ontology
Matching workshop2collocated with ISWC, in Riva del Garda, Italy.
Since 2011, we have been using an environment for automatically processing eval-uations (§2.2), which has been developed within the SEALS (Semantic Evaluation At
Large Scale) project3. SEALS provided a software infrastructure, for automatically
exe-cuting evaluations, and evaluation campaigns for typical semantic web tools, including ontology matching. For OAEI 2014, almost all of the OAEI data sets were evaluated under the SEALS modality, providing a more uniform evaluation setting.
This paper synthetizes the 2014 evaluation campaign and introduces the results pro-vided in the papers of the participants. The remainder of the paper is organised as fol-lows. In Section 2, we present the overall evaluation methodology that has been used. Sections 3-10 discuss the settings and the results of each of the test cases. Section 12 overviews lessons learned from the campaign. Finally, Section 13 concludes the paper.
2
General methodology
We first present the test cases proposed this year to the OAEI participants (§2.1). Then, we discuss the resources used by participants to test their systems and the execution environment used for running the tools (§2.2). Next, we describe the steps of the OAEI campaign (§2.3-2.5) and report on the general execution of the campaign (§2.6).
2.1 Tracks and test cases
This year’s campaign consisted of 7 tracks gathering 9 test cases and different evalua-tion modalities:
1http://oaei.ontologymatching.org
2http://om2014.ontologymatching.org
The benchmark track (§3): Like in previous campaigns, a systematic benchmark se-ries has been proposed. The goal of this benchmark sese-ries is to identify the areas in which each matching algorithm is strong or weak by systematically altering an ontology. This year, we generated a new benchmark based on the original biblio-graphic ontology and two new benchmarks based on different ontologies.
The expressive ontology track offers real world ontologies using OWL modelling ca-pabilities:
Anatomy (§4): The anatomy real world test case is about matching the Adult Mouse Anatomy (2744 classes) and a small fragment of the NCI Thesaurus (3304 classes) describing the human anatomy.
Conference (§5): The goal of the conference test case is to find all correct crespondences within a collection of ontologies describing the domain of or-ganizing conferences. Results were evaluated automatically against reference alignments and by using logical reasoning techniques.
Large biomedical ontologies (§6): The Largebio test case aims at finding align-ments between large and semantically rich biomedical ontologies such as FMA, SNOMED-CT, and NCI. The UMLS Metathesaurus has been used as the basis for reference alignments.
Multilingual
Multifarm (§7): This test case is based on a subset of the Conference data set,
translated into eight different languages (Chinese, Czech, Dutch, French, Ger-man, Portuguese, Russian, and Spanish) and the corresponding alignments be-tween these ontologies. Results are evaluated against these alignments. Directories and thesauri
Library (§8): The library test case is a real-world task to match two thesauri. The
goal of this test case is to find whether the matchers can handle such lightweight ontologies including a huge amount of concepts and additional descriptions. Results are evaluated both against a reference alignment and through manual scrutiny.
Interactive matching
Interactive (§9): This test case offers the possibility to compare different interac-tive matching tools which require user interaction. Its goal is to show if user interaction can improve matching results, which methods are most promising and how many interactions are necessary. All participating systems are evalu-ated on the conference data set using an oracle based on the reference align-ment.
Ontology Alignment For Query Answering OA4QA (§10): This test case offers the possibility to evaluate alignments in their ability to enable query answering in an ontology based data access scenario, where multiple aligned ontologies ex-ist. In addition, the track is intended as a possibility to study the practical effects of logical violations affecting the alignments, and to compare the different re-pair strategies adopted by the ontology matching systems. In order to facilitate the understanding of the dataset and the queries, the conference data set is used, extended with synthetic ABoxes.
test formalism relations confidence modalities language SEALS
benchmark OWL = [0 1] blind EN √
anatomy OWL = [0 1] open EN √
conference OWL =, <= [0 1] blind+open EN √
large bio OWL = [0 1] open EN √
multifarm OWL = [0 1] open CZ, CN, DE, EN, √
ES, FR, NL, RU, PT
library OWL = [0 1] open EN, DE √
interactive OWL =, <= [0 1] open EN √
OA4QA OWL =, <= [0 1] open EN
im-identity OWL = [0 1] blind EN, IT √
im-similarity OWL <= [0 1] blind EN, IT √
Table 1. Characteristics of the test cases (open evaluation is made with already published refer-ence alignments and blind evaluation is made by organizers from referrefer-ence alignments unknown to the participants).
Instance matching
Identity (§11): The identity task is a typical evaluation task of instance matching tools where the goal is to determine when two OWL instances describe the same real-world entity.
Similarity(§11): The similarity task focuses on the evaluation of the similarity
degree between two OWL instances, even when they describe different real-world entities. Similarity recognition is new in the instance matching track of OAEI, but this kind of task is becoming a common issue in modern web applications where large quantities of data are daily published and usually need to be classified for effective fruition by the final user.
Table 1 summarizes the variation in the proposed test cases.
2.2 The SEALS platform
Since 2011, tool developers had to implement a simple interface and to wrap their tools in a predefined way including all required libraries and resources. A tutorial for tool wrapping was provided to the participants. It describes how to wrap a tool and how to use a simple client to run a full evaluation locally. After local tests are passed
success-fully, the wrapped tool had to be uploaded on the SEALS portal4. Consequently, the
evaluation was executed by the organizers with the help of the SEALS infrastructure. This approach allowed to measure runtime and ensured the reproducibility of the re-sults. As a side effect, this approach also ensures that a tool is executed with the same settings for all of the test cases that were executed in the SEALS mode.
2.3 Preparatory phase
Ontologies to be matched and (where applicable) reference alignments have been
pro-vided in advance during the period between June 15th and July 3rd, 2014. This gave
potential participants the occasion to send observations, bug corrections, remarks and other test cases to the organizers. The goal of this preparatory period is to ensure that the delivered tests make sense to the participants. The final test base was released on
July 3rd, 2014. The (open) data sets did not evolve after that.
2.4 Execution phase
During the execution phase, participants used their systems to automatically match the test case ontologies. In most cases, ontologies are described in OWL-DL and serialized in the RDF/XML format [7]. Participants can self-evaluate their results either by com-paring their output with reference alignments or by using the SEALS client to compute precision and recall. They can tune their systems with respect to the non blind evalua-tion as long as the rules published on the OAEI web site are satisfied. This phase has
been conducted between July 3rdand September 1st, 2014.
2.5 Evaluation phase
Participants have been encouraged to upload their wrapped tools on the SEALS portal
by September 1st, 2014. For the SEALS modality, a full-fledged test including all
sub-mitted tools has been conducted by the organizers and minor problems were reported to some tool developers, who had the occasion to fix their tools and resubmit them.
First results were available by October 1st, 2014. The organizers provided these
results individually to the participants. The results were published on the respective
web pages by the organizers by October 15st. The standard evaluation measures are
usually precision and recall computed against the reference alignments. More details on evaluation measures are given in each test case section.
2.6 Comments on the execution
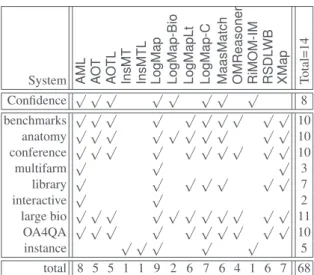
The number of participating systems has regularly increased over the years: 4 partici-pants in 2004, 7 in 2005, 10 in 2006, 17 in 2007, 13 in 2008, 16 in 2009, 15 in 2010, 18 in 2011, 21 in 2012, 23 in 2013. However, 2014 has suffered a significant decrease with only 14 systems. However, participating systems are now constantly changing. In 2013, 11 (7 in 2012) systems had not participated in any of the previous campaigns. The list of participants is summarized in Table 2. Note that some systems were also evaluated with different versions and configurations as requested by developers (see test case sections for details).
Finally, some systems were not able to pass some test cases as indicated in Table 2. The result summary per test case is presented in the following sections.
System AML AO
T
A
O
TL
InsMT InsMTL LogMap LogMap-Bio LogMapLt LogMap-C MaasMatch OMReasoner RiMOM-IM RSDL
WB XMap Total=14 Confidence √ √ √ √ √ √ √ √ 8 benchmarks √ √ √ √ √ √ √ √ √ √ 10 anatomy √ √ √ √ √ √ √ √ √ √ 10 conference √ √ √ √ √ √ √ √ √ √ 10 multifarm √ √ √ 3 library √ √ √ √ √ √ √ 7 interactive √ √ 2 large bio √ √ √ √ √ √ √ √ √ √ √ 11 OA4QA √ √ √ √ √ √ √ √ √ √ 10 instance √ √ √ √ √ 5 total 8 5 5 1 1 9 2 6 7 6 4 1 6 7 68
Table 2. Participants and the state of their submissions. Confidence stands for the type of results returned by a system: it is ticked when the confidence is a non boolean value.
3
Benchmark
The goal of the benchmark data set is to provide a stable and detailed picture of each algorithm. For that purpose, algorithms are run on systematically generated test cases.
3.1 Test data
The systematic benchmark test set is built around a seed ontology and many variations of it. Variations are artificially generated by discarding and modifying features from a seed ontology. Considered features are names of entities, comments, the specialization hierarchy, instances, properties and classes. This test focuses on the characterization of the behavior of the tools rather than having them compete on real-life problems. Full description of the systematic benchmark test set can be found on the OAEI web site.
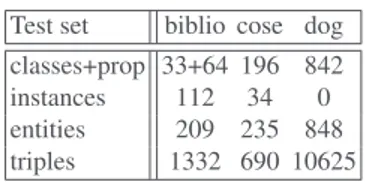
Since OAEI 2011.5, the test sets are generated automatically by the test generator described in [14] from different seed ontologies. This year, we used three ontologies: biblio The bibliography ontology used in the previous years which concerns
biblio-graphic references and is inspired freely from BibTeX;
cose COSE5is the Casas Ontology for Smart Environments;
dog DogOnto6is an ontology describing aspects of intelligent domotic environments.
The characteristics of these ontologies are described in Table 3.
The test cases were not available to participants. They still could test their systems with respect to previous year data sets, but they have been evaluated against newly
5http://casas.wsu.edu/owl/cose.owl
Test set biblio cose dog
classes+prop 33+64 196 842
instances 112 34 0
entities 209 235 848
triples 1332 690 10625
Table 3. Characteristics of the three seed ontologies used in benchmarks.
generated tests. The tests were also blind for the organizers since we did not looked into them before running the systems.
The reference alignments are still restricted to named classes and properties and use the “=” relation with confidence of 1.
3.2 Results
Evaluations were run on a Debian Linux virtual machine configured with four proces-sors and 8GB of RAM running under a Dell PowerEdge T610 with 2*Intel Xeon Quad Core 2.26GHz E5607 processors and 32GB of RAM, under Linux ProxMox 2 (Debian). All matchers where run under the SEALS client using Java 1.7 and a maximum heap size of 8GB (which has been necessary for the larger tests, i.e., dog). No timeout was explicitly set.
Reported figures are the average of 5 runs. As has already been shown in [14], there is not much variance in compliance measures across runs. This is not necessarily the case for time measurements so we report standard deviations with time measurements.
Participation From the 13 systems participating to OAEI this year, 10 systems partic-ipated in this track. A few of these systems encountered problems:
– RSDLWBon cose
– OMReasoneron dog
We did not investigate these problems. We tried another test with many more ontologies
an all matchers worked butAML.
Compliance Table 4 presents the harmonic means of precision, F-measure and recall for the test suites for all the participants, along with their confidence-weighted values. It also shows measures provided by edna, a simple edit distance algorithm on labels which is used as a baseline.
Some systems have had constant problems with the most strongly altered tests to
the point of not outputing results:LogMap-C,LogMap,MaasMatch. Problems were also
encountered to a smaller extent by XMap2.OMReasonerfailed to return any answer on
dog, andRSDLWBon cose.
Concerning F-measure results, theAOTLsystem seems to achieve the best results
beforeRSDLWB.AOTLis also well balanced: it always achieve more than 50% recall
biblio cose dog
Matcher Prec. F-m. Rec. Prec. F-m. Rec. Prec. F-m. Rec.
edna .35(.58) .41(.54) .50 .44(.72) .47(.59) .50 .50(.74) .50(.60) .50 AML .92(.94) .55(.56) .39 .46(.59) .46(.51) .46(.45) .98(.96) .73(.71) .58(.57) AOT .80(.90) .64(.67) .53 .69(.84) .58(.63) .50 .62(.77) .62(.68) .61 AOTL .85(.89) .65(.66) .53 .94(.95) .65(.65) .50 .97 .74(.75) .60 LogMap .40(.40) .40(.39) .40(.37) .38(.45) .41(.40) .45(.37) .96(.91) .15(.14) .08(.07) LogMap-C .42(.41) .41(.39) .40(.37) .39(.45) .41(.40) .43(.35) .98(.92) .15(.13) .08(.07) LogMapLite .43 .46 .50 .37 .43 .50 .86 .71 .61 MaasMatch .97 .56 .39 .98 .48 .31 .92 .55 .39 OMReasoner .73 .59 .50 .08 .14 .50 * * * RSDLWB .99 .66 .50 * * * .99 .75 .60 XMap2 1.0 .57 .40 1.0 .28 .17 1.0 .32 .20
Table 4. Aggregated benchmark results: Harmonic means of precision, F-measure and recall, along with their confidence-weighted values (*: uncompleted results).
did not provide results on the third one.AOTis a close follower ofAOTL.AMLhad very
good results on dog andOMReasoneron biblio. The three systems showing the best
performances at benchmarks (AOT,AOTLand RSDLWD) also preformed systematicly
worse than other systems (AML,LogMap,XMap) at other tasks. This may reveal some
degree of overfitting. . . either of the former to benchmarks, or of the latter to the other tests.
In general, results of the best matchers are largely lower than those of the best matchers in the previous year.
We can consider that we have high-precision matchers (XMap2: 1.0,RSDLWB: .99,
MaasMatch: .92-.98;AML: (.46)-.98).LogMap-C,LogMapachieve also very high
pre-cision in dog (their other bad prepre-cision are certainly due toLogMapreturning matched
instances which are not in reference alignments). Of these high-precision matchers,
RSDLWBis remarkable since it achieves a 50% recall (when it works).
The recall of systems is generally high with figures around 50% but this may be due to the structure of benchmarks.
Confidence-weighted measures reward systems able to provide accurate confidence values. Using confidence-weighted F-measures usually increase F-measure of systems showing that they are able to provide a meaningful assessment of their correspondences.
The exception to this rule isLogMapwhose weighted values are lower. Again, this may
be due to the output of correspondences out of the ontology namespace or instance correspondences.
speed Table 5 provides the average time and standard deviation and F-measure point provided per second by matchers. The F-measure point provided per second shows
that efficient matchers are XMap2 andLogMapLitefollowed byAML(these results are
consistent on cose and dog, biblio is a bit different but certainly due to errors reported above). The time taken by systems on the two first test sets is very stable (and short); it is longer and less stable on the larger dog test set.
biblio cose dog
Matcher time stdev F-m./s. time stdev F-m./s. time stdev F-m./s.
AML 48.96 ±1.21% 1.12 140.29 ±0.98% 0.33 1506.16 ±5.42% 0.05 AOT 166.91±1.11% 0.38 194.02 ±0.68% 0.30 10638.27 ±0.77% 0.01 AOTL 741.98±1.13% 0.09 386.18 ±1.94% 0.17 18618.60 ±1.44% 0.00 LogMap 106.68±0.84% 0.37 123.44 ±1.45% 0.33 472.31 ±15.67% 0.03 LogMap-C 158.36±0.53% 0.26 188.30 ±1.22% 0.22 953.56 ±18.94% 0.02 LogMapLite 61.43 ±1.06% 0.75 62.67 ±1.48% 0.69 370.32 ±24.51% 0.19 MaasMatch 122.50±2.24% 0.46 392.43 ±1.78% 0.12 7338.92 ±1.85% 0.01 OMReasoner 60.01 ±0.43% 0.98 98.17 ±0.91% 0.14 331.65 ±59.35% * RSDLWB 86.22 ±2.03% 0.77 * * * 14417.32 ±1.98% 0.01 XMap2 68.67 ±0.95% 0.83 31.39 ±38.99% 0.89 221.83 ±55.44% 0.14
Table 5. Aggregated benchmark results: Time (in second), standard deviation on time and points of F-measure per second spent on the three data sets (*: uncompleted results).
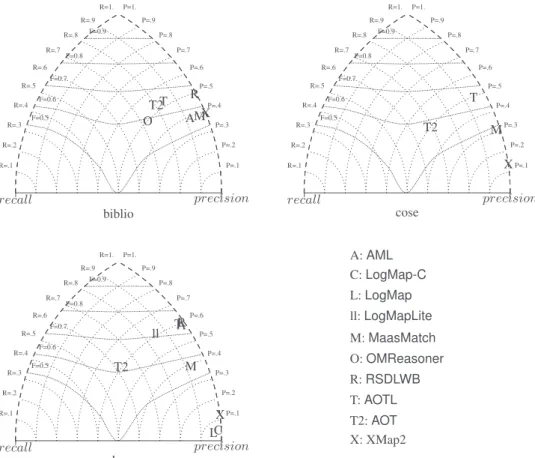
Comparison Figure 1 shows the triangle graphs for the three tests. It confirms the
impressions above: systems are very precision-oriented butAOT which stands in the
middle of the graph.AOTLhas, in general, good results.
3.3 Conclusions
This year, matcher performance has been lower than in previous years, even on the genuine biblio dataset. The systems are able to process the test set without problem, even if some of them return many empty alignments. They are, as usual, very oriented towards precision at the expense of recall.
R=1. R=.9 R=.8 R=.7 R=.6 R=.5 R=.4 R=.3 R=.2 R=.1 P=1. P=.9 P=.8 P=.7 P=.6 P=.5 P=.4 P=.3 P=.2 P=.1 F=0.5 F=0.6 F=0.7 F=0.8 F=0.9 recall precision T2T M A X R O biblio R=1. R=.9 R=.8 R=.7 R=.6 R=.5 R=.4 R=.3 R=.2 R=.1 P=1. P=.9 P=.8 P=.7 P=.6 P=.5 P=.4 P=.3 P=.2 P=.1 F=0.5 F=0.6 F=0.7 F=0.8 F=0.9 recall precision T2 T M X cose R=1. R=.9 R=.8 R=.7 R=.6 R=.5 R=.4 R=.3 R=.2 R=.1 P=1. P=.9 P=.8 P=.7 P=.6 P=.5 P=.4 P=.3 P=.2 P=.1 F=0.5 F=0.6 F=0.7 F=0.8 F=0.9 recall precision T2 T ll C L M A X R dog A: AML C: LogMap-C L: LogMap ll: LogMapLite M: MaasMatch O: OMReasoner R: RSDLWB T: AOTL T2: AOT X: XMap2
Fig. 1. Triangle view on the three benchmark data sets (non present systems have too low F-measure).
4
Anatomy
The anatomy test case confronts matchers with a specific type of ontologies from the biomedical domain. We focus on two fragments of biomedical ontologies which
de-scribe the human anatomy7and the anatomy of the mouse8. This data set has been used
since 2007 with some improvements over the years.
4.1 Experimental setting
We conducted experiments by executing each system in its standard setting and we compare precision, recall, F-measure and recall+. The recall+ measure indicates the amount of detected non-trivial correspondences. The matched entities in a non-trivial correspondence do not have the same normalized label. The approach that generates
only trivial correspondences is depicted as baselineStringEquivin the following section.
As last year, we run the systems on a server with 3.46 GHz (6 cores) and 8GB RAM allocated to the matching systems. Further, we used the SEALS client to execute our evaluation. However, we slightly changed the way precision and recall are computed, i.e., the results generated by the SEALS client vary in some cases by 0.5% compared to the results presented below. In particular, we removed trivial correspondences in the
oboInOwlnamespace such as
http://...oboInOwl#Synonym = http://...oboInOwl#Synonym as well as correspondences expressing relations different from equivalence. Using the Pellet reasoner we also checked whether the generated alignment is coherent, i.e., there are no unsatisfiable concepts when the ontologies are merged with the alignment.
4.2 Results
In Table 6, we analyze all participating systems that could generate an alignment in less than ten hours. The listing comprises 10 entries. There were 2 systems which
partic-ipated with different versions. These areAOTwith versionsAOTandAOTL,LogMap
with four different versionsLogMap,LogMap-Bio,LogMap-Cand a lightweight
ver-sion,LogMapLite, that uses only some core components. In addition toLogMap and
LogMapLite, 3 more systems which participated in 2013 and now participated with new
versions (AML,MaasMatch,XMap). For more details, we refer the reader to the
pa-pers presenting the systems. Thus, 10 different systems generated an alignment within
the given time frame. There were four participants (InsMT,InsMTL,OMReasonerand
RiMOM-IM) that threw an exception or produced an empty alignment and are not
con-sidered in the evaluation.
We have 6 systems which finished in less than 100 seconds, compared to 10 systems in OAEI 2013 and 8 systems in OAEI 2012. This year we have 10 out of 13 systems which generated results which is comparable to last year when 20 out of 24 systems
7http://www.cancer.gov/cancertopics/cancerlibrary/
terminologyresources/
Matcher Runtime Size Precision F-measure Recall Recall+ Coherent AML 28 1478 0.956 0.944 0.932 0.822 √ LogMap-Bio 535 1547 0.888 0.897 0.906 0.752 √ XMap 22 1370 0.940 0.893 0.850 0.606 √ LogMap 12 1398 0.918 0.881 0.846 0.595 √ LogMapLite 5 1148 0.962 0.829 0.728 0.290 -MaasMatch 49 1187 0.914 0.803 0.716 0.248 -LogMap-C 22 1061 0.975 0.802 0.682 0.433 √ StringEquiv - 946 1.000 0.770 0.620 0.000 -RSDLWB 1337 941 0.978 0.749 0.607 0.01 -AOT 896 2698 0.436 0.558 0.775 0.405 -AOTL 2524 167 0.707 0.140 0.078 0.010
-Table 6. Comparison, ordered by F-measure, against the reference alignment, runtime is mea-sured in seconds, the “size” column refers to the number of correspondences in the generated alignment.
generated results within the given time frame. The top systems in terms of runtimes are
LogMap,XMapandAML. Depending on the specific version of the systems, they require
between 5 and 30 seconds to match the ontologies. The table shows that there is no correlation between quality of the generated alignment in terms of precision and recall and required runtime. This result has also been observed in previous OAEI campaigns. Table 6 also shows the results for precision, recall and measure. In terms of
F-measure, the top ranked systems areAML,LogMap-Bio,LogMapandXMap. The
lat-ter two generate similar alignments. The results of these four systems are at least as
good as the results of the best systems in OAEI 2007-2010.AMLhas the highest
F-measure up to now. Other systems in earlier years that obtained an F-F-measure that is at
least as good as the fourth system this year areAgreementMaker(predecessor ofAML)
(2011, F-measure: 0.917),GOMMA-bk(2012/2013, F-measure: 0.923/0.923),YAM++
(2012/2013, F-measure 0.898/0.905), andCODI(2012, F-measure: 0.891).
This year we have 7 out of 10 systems which achieved an F-measure that is higher than the baseline which is based on (normalized) string equivalence (StringEquiv in the table). This is a better result (percentage-wise) than the last year but still lower than in OAEI 2012 when 13 out of 17 systems produced alignments with F-measure higher
than the baseline. Both systems,XMapandMaasMatch, which participated in the last
year and had results below the baseline, achieved better results than the baseline this year.
Moreover, nearly all systems find many non-trivial correspondences. Exceptions
areRSDLWBandAOTLthat generate an alignment that is quite similar to the alignment
generated by the baseline approach.
There are 5 systems which participated in the last year,AML,LogMap,LogMapLite,
MaasMatchandXMap. From these systemsLogMapandLogMapLiteachieved identical
results as last year, whileAML,MaasMatchandXMapimproved their results.
Maas-MatchandXMapshowed a considerable improvement. In the case ofMaasMatch, its
precision was improved from 0.359 to 0.914 (and the F-measure from 0.409 to 0.803)
from 0.856 to 0.94 (and F-measure from 0.753 to 0.893) compared to the XMapSig version which achieved a better F-measure last year.
A positive trend can be seen when it comes to coherence of alignments. Last year only 3 systems out of 20 produced a coherent alignment while this year half of the systems produced coherent alignment.
4.3 Conclusions
This year 14 systems participated in the anatomy track out of which 10 produced re-sults. This is a significant decrease in the number of participating systems. However, the majority of the systems which participated in the last year significantly improved their results.
As last year, we have witnessed a positive trend in runtimes as all the systems which produced an alignment finished execution in less than an hour. Same as the last year,
theAMLsystem set the top result for the anatomy track by improving the result from
the last year. TheAMLsystem improved in terms of all measured metrics.
5
Conference
The conference test case introduces matching several moderately expressive ontologies. Within this test case, participant alignments were evaluated against reference align-ments (containing merely equivalence correspondences) and by using logical reasoning. The evaluation has been performed with the SEALS infrastructure.
5.1 Test data
The data set consists of 16 ontologies in the domain of organizing conferences. These
ontologies have been developed within the OntoFarm project9.
The main features of this test case are:
– Generally understandable domain. Most ontology engineers are familiar with or-ganizing conferences. Therefore, they can create their own ontologies as well as evaluate the alignments among their concepts with enough erudition.
– Independence of ontologies. Ontologies were developed independently and based on different resources, they thus capture the issues in organizing conferences from different points of view and with different terminologies.
– Relative richness in axioms. Most ontologies were equipped with OWL DL axioms of various kinds; this opens a way to use semantic matchers.
Ontologies differ in their numbers of classes, of properties, in expressivity, but also in underlying resources.
9
5.2 Results
We provide results in terms of F0.5-measure, F1-measure and F2-measure,
compari-son with baseline matchers and results from previous OAEI editions, precision/recall triangular graph and coherency evaluation.
Evaluation based on reference alignments We evaluated the results of participants against blind reference alignments (labelled as ra2 on the conference web page). This includes all pairwise combinations between 7 different ontologies, i.e. 21 alignments.
These reference alignments have been generated as a transitive closure computed on the original reference alignments. In order to obtain a coherent result, conflicting correspondences, i.e., those causing unsatisfiability, have been manually inspected and removed by evaluators. As a result, the degree of correctness and completeness of the new reference alignment is probably slightly better than for the old one. However, the differences are relatively limited. Whereas the new reference alignments are not open, the old reference alignments (labeled as ra1 on the conference web-page) are available. These represent close approximations of the new ones.
Matcher Prec. F0.5-m. F1-m. F2-m. Rec. Size Inc. Al. Inc-dg
AML 0.8 0.74 0.67 0.61 0.58 10.952 0 0.0% LogMap 0.76 0.7 0.63 0.57 0.54 10.714 0 0.0% LogMap-C 0.78 0.71 0.62 0.56 0.52 10.238 0 0.0% XMap 0.82 0.7 0.57 0.48 0.44 8.143 0 0.0% edna 0.73 0.64 0.55 0.48 0.44 AOT* 0.75 0.65 0.55 0.47 0.43 59.167 18 40.4% RSDLWB 0.76 0.65 0.54 0.46 0.42 8.333 4 2.5% LogMapLite 0.68 0.62 0.54 0.48 0.45 9.905 7 5.4% OMReasoner 0.77 0.66 0.54 0.46 0.42 8.095 4 2.5% StringEquiv 0.76 0.64 0.52 0.43 0.39 AOTL 0.73 0.62 0.51 0.43 0.39 14.667 17 15.1% MaasMatch* 0.52 0.51 0.5 0.5 0.49 33 19 21.0%
Table 7. The highest average F[0.5|1|2]-measure and their corresponding precision and recall for each matcher with its F1-optimal threshold (ordered by F1-measure). Average size of alignments,
number of incoherent alignments and average degree of incoherence. The mark * is added when we only provide lower bound of the degree of incoherence due to the combinatorial complexity of the problem.
Table 7 shows the results of all participants with regard to the reference alignment.
F0.5-measure, F1-measure and F2-measure are computed for the threshold that provides
the highest average F1-measure. F1is the harmonic mean of precision and recall where
both are equally weighted; F2weights recall higher than precision and F0.5weights
pre-cision higher than recall. The matchers shown in the table are ordered according to their
highest average F1-measure. We employed two baseline matchers. edna (string edit
dis-tance matcher) is used within the benchmark test case and with regard to performance it is very similar as previously used baseline2 in the conference track; StringEquiv is used within the anatomy test case. These baselines divide matchers into three groups. Group
1 consists of matchers (AML,LogMap,LogMap-C,XMap andAOT) having better (or
the same) results than both baselines in terms of highest average F1-measure. Group 2
consists of matchers (RSDLWB,LogMapLiteandOMReasoner) performing better than
baseline StringEquiv. Other matchers (AOTLandMaasMatch) performed slightly worse
than both baselines.
Performance of all matchers regarding their precision, recall and F1-measure is
vi-sualized in Figure 2. Matchers are represented as squares or triangles. Baselines are represented as circles.
rec=1.0 rec=.8 rec=.6 pre=.6 pre=.8 pre=1.0
F1-measure=0.5 F1-measure=0.6 F1-measure=0.7 AML LogMap LogMap-C XMap AOT RSDLWB LogMapLite OMReasoner AOTL MaasMatch edna StringEquiv
Fig. 2. Precision/recall triangular graph for the conference test case. Dotted lines depict level of precision/recall while values of F1-measure are depicted by areas bordered by corresponding
lines F1-measure=0.[5|6|7].
Comparison with previous years Five matchers also participated in this test case in
OAEI 2013. The largest improvement was achieved byMaasMatch(precision from .27
to .52, while recall decreased from .53 to .49),AML(precision decreased from .82 to
.80, but recall increased from .51 to .58) andXMap(precision from .68 to .82, whereas
recall remains the same, .44).
Runtimes We measured the total time of generating 21 alignments. It was executed on a laptop under Ubuntu running on Intel Core i5, 2.67GHz and 8GB RAM except
MaasMatchrun which was run on Intel Core i7, 2.10GHz x 4 and 16GB RAM. This
year all matchers finished all 21 testcases within 70 seconds. Four matchers finished
all 21 test cases within 16 seconds (OMReasoner: 10s,LogMapLite: 11s,AML: 14s and
AOT: 16s). Next, five matchers needed less than 1 minute (LogMap: 26s,XMap: 26s,
RSDLWB: 36s,LogMap-C: 44s,AOTL: 45s). Finally, one matcher (MaasMatch) needed
In conclusion, regarding performance we can see (clearly from Figure 2) that al-most all participants managed to achieve a higher performance than baseline matcher.
Three matchers (AML,LogMapandLogMap-C) exceeded a 0.6 F1-measure and all other
matchers are above 0.5. On the other side no matcher achieved a 0.7 F1-measure. Re-garding runtime, the four fastest matchers this year managed to be faster than the fastest matcher last year (measured on the same machine) and no matcher needed more than 70 seconds which is much faster than last year (40 minutes).
Evaluation based on alignment coherence As in the previous years, we apply the Maximum Cardinality measure to evaluate the degree of alignment incoherence. Details on this measure and its implementation can be found in [23].
We computed the average for all 21 test cases of the conference track for which there exists a reference alignment. In two cases (marked with an asterisk) we could not compute the exact degree of incoherence due to the combinatorial complexity of the problem, however we were still able to compute a lower bound for which we know that the actual degree is not lower.
The systemsAML,LogMap(excludingLogMapLite, where reasoning option is
dis-abled), andXMapgenerate coherent alignments. However, these systems generated
co-herent alignments already in 2013. The other systems generate results with highly vary-ing degree of incoherence. The degree of incoherence is correlated with the size of the generated alignments. This can be expected because smaller alignments are usually more precise and logical conflicts will occur only rarely. However, there are systems
with relatively small alignments that cannot ensure coherence (e.g.,OMReasonerand
RSDLWB). Overall, the field has not improved compared to last year with respect to
gen-erating coherent alignments respecting the logical constraints implied by the axioms of the matched ontologies.
6
Large biomedical ontologies (largebio)
The Largebio test case aims at finding alignments between the large and semantically rich biomedical ontologies FMA, SNOMED-CT, and NCI, which contains 78,989, 306,591 and 66,724 classes, respectively.
6.1 Test data
The test case has been split into three matching problems: FMA-NCI, FMA-SNOMED and SNOMED-NCI; and each matching problem in 2 tasks involving different frag-ments of the input ontologies.
The UMLS Metathesaurus [3] has been selected as the basis for reference align-ments. UMLS is currently the most comprehensive effort for integrating independently-developed medical thesauri and ontologies, including FMA, SNOMED-CT, and NCI. Although the standard UMLS distribution does not directly provide alignments (in the sense of [15]) between the integrated ontologies, it is relatively straightforward to ex-tract them from the information provided in the distribution files (see [18] for details).
It has been noticed, however, that although the creation of UMLS alignments com-bines expert assessment and auditing protocols they lead to a significant number of logical inconsistencies when integrated with the corresponding source ontologies [18]. Since alignment coherence is an aspect of ontology matching that we aim to pro-mote in the Large BioMed track, in previous editions we provided coherent reference alignments by refining the UMLS mappings using Alcomo (alignment) debugging
sys-tem [23],LogMap’s (alignment) repair facility [17], or both [19].
However, concerns were raised about the validity and fairness of applying auto-mated alignment repair techniques to make reference alignments coherent [27]. It is clear that using the original (incoherent) UMLS alignments would be penalizing to on-tology matching systems that perform alignment repair. However, using automatically repaired alignments would penalize systems that do not perform alignment repair and also systems that employ a repair strategy that differs from that used on the reference alignments [27].
Thus, for this year’s edition of the largebio track we arrived at a compromising solu-tion that should be fair to all ontology matching systems. Instead of repairing the refer-ence alignments as normal, by removing correspondrefer-ences, we flagged the incoherrefer-ence-
incoherence-causing correspondencesin the alignments by setting the relation to “?” (unknown). These “?” correspondences will neither be considered as positive nor as negative when evaluating the participating ontology matching systems, but will simply be ignored. This way, systems that do not perform alignment repair are not penalized for finding correspondences that (despite causing incoherences) may or may not be correct, and systems that do perform alignment repair are not penalized for removing such corre-spondences.
To ensure that this solution was as fair as possible to all alignment repair strategies,
we flagged as unknown all correspondences suppressed by any of Alcomo,LogMapor
AML[29], as well as all correspondences suppressed from the reference alignments of
last year’s edition (using Alcomo andLogMapcombined). Note that, we have used the
(incomplete) repair modules of the above mentioned systems.
The flagged UMLS-based reference alignment for the OAEI 2014 campaign is sum-marised as follows:
– FMA-NCI reference alignment: 2,686 “=” mappings, 338 “?” mappings – FMA-SNOMED reference alignment: 6,026 “=” mappings, 2,982 “?” mappings – SNOMED-NCI reference alignment: 17,210 “=” mappings, 1,634 “?” mappings
6.2 Evaluation setting, participation and success
We have run the evaluation in a Ubuntu Laptop with an Intel Core i7-4600U CPU @ 2.10GHz x 4 and allocating 15Gb of RAM. Precision, Recall and F-measure have been computed with respect to the UMLS-based reference alignment. Systems have been ordered in terms of F-measure.
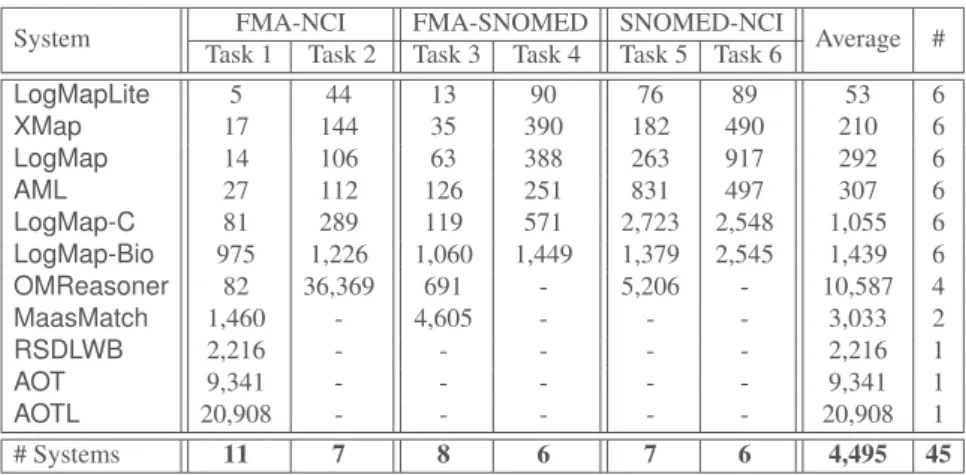
In the largebio test case, 11 out of 14 participating systems have been able to cope with at least one of the tasks of the largebio test case. It is surprising, but for the first year the largebio track had the largest participation with respect to the other tracks.
System FMA-NCI FMA-SNOMED SNOMED-NCI Average #
Task 1 Task 2 Task 3 Task 4 Task 5 Task 6
LogMapLite 5 44 13 90 76 89 53 6 XMap 17 144 35 390 182 490 210 6 LogMap 14 106 63 388 263 917 292 6 AML 27 112 126 251 831 497 307 6 LogMap-C 81 289 119 571 2,723 2,548 1,055 6 LogMap-Bio 975 1,226 1,060 1,449 1,379 2,545 1,439 6 OMReasoner 82 36,369 691 - 5,206 - 10,587 4 MaasMatch 1,460 - 4,605 - - - 3,033 2 RSDLWB 2,216 - - - 2,216 1 AOT 9,341 - - - 9,341 1 AOTL 20,908 - - - 20,908 1 # Systems 11 7 8 6 7 6 4,495 45
Table 8. System runtimes (s) and task completion.
RiMOM-IM,InsMTandInsMTLare systems focusing in the instance matching track and
they did not produce any alignment for the largebio track.
Regarding the use of background knowledge,LogMap-Bio uses BioPortal as
me-diating ontology provider, that is, it retrieves from BioPortal the most suitable top-5 ontologies for the matching task.
6.3 Alignment coherence
Together with Precision, Recall, F-measure and Runtimes we have also evaluated the coherence of alignments. We report (1) the number of unsatisfiabilities when reasoning with the input ontologies together with the computed alignments, and (2) the ratio of unsatisfiable classes with respect to the size of the union of the input ontologies.
We have used the OWL 2 reasoner HermiT [25] to compute the number of unsatisfi-able classes. For the cases in which MORe could not cope with the input ontologies and the alignments (in less than 2 hours) we have provided a lower bound on the number of
unsatisfiable classes (indicated by≥) using the OWL 2 EL reasoner ELK [20].
In this OAEI edition, only two systems have shown alignment repair facilities,
namely:AMLandLogMap(includingLogMap-BioandLogMap-Cvariants). Tables
9-12 (see last two columns) show that even the most precise alignment sets may lead to a huge amount of unsatisfiable classes. This proves the importance of using techniques to assess the coherence of the generated alignments if they are to be used in tasks involving reasoning.
6.4 Runtimes and task completion
Table 8 shows which systems were able to complete each of the matching tasks in less than 10 hours and the required computation times. Systems have been ordered with respect to the number of completed tasks and the average time required to complete them. Times are reported in seconds.
Task 1: small FMA and NCI fragments
System Time (s) # Corresp. Scores Incoherence
Prec. F-m. Rec. Unsat. Degree
AML 27 2,690 0.96 0.93 0.90 2 0.02% LogMap 14 2,738 0.95 0.92 0.90 2 0.02% LogMap-Bio 975 2,892 0.91 0.92 0.92 467 4.5% XMap 17 2,657 0.93 0.89 0.85 3,905 38.0% LogMapLite 5 2,479 0.97 0.89 0.82 2,103 20.5% LogMap-C 81 2,153 0.96 0.83 0.72 2 0.02% MaasMatch 1,460 2,981 0.81 0.82 0.84 8,767 85.3% Average 3,193 2,287 0.91 0.76 0.70 2,277 22.2% AOT 9,341 3,696 0.66 0.75 0.85 8,373 81.4% OMReasoner 82 1,362 0.99 0.63 0.47 56 0.5% RSDLWB 2,216 728 0.96 0.38 0.24 22 0.2% AOTL 20,908 790 0.90 0.38 0.24 1,356 13.2%
Task 2: whole FMA and NCI ontologies
System Time (s) # Corresp. Scores Incoherence
Prec. F-m. Rec. Unsat. Degree
AML 112 2,931 0.83 0.84 0.86 10 0.007% LogMap 106 2,678 0.86 0.83 0.81 13 0.009% LogMap-Bio 1,226 3,412 0.72 0.79 0.87 40 0.027% XMap 144 2,571 0.83 0.79 0.75 9,218 6.3% Average 5,470 2,655 0.82 0.77 0.75 5,122 3.5% LogMap-C 289 2,124 0.88 0.75 0.65 9 0.006% LogMapLite 44 3,467 0.67 0.74 0.82 26,441 18.1% OMReasoner 36,369 1,403 0.96 0.63 0.47 123 0.084%
Table 9. Results for the FMA-NCI matching problem.
The last column reports the number of tasks that a system could complete. For example, 6 system were able to complete all six tasks. The last row shows the number of systems that could finish each of the tasks. The tasks involving SNOMED were also harder with respect to both computation times and the number of systems that completed the tasks.
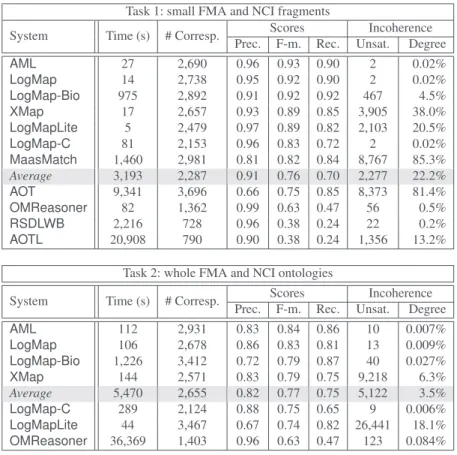
6.5 Results for the FMA-NCI matching problem
Table 9 summarizes the results for the tasks in the FMA-NCI matching problem. The following tables summarize the results for the tasks in the FMA-NCI matching problem.
LogMap-Bio and AML provided the best results in terms of both Recall and
F-measure in Task 1 and Task 2, respectively.OMReasonerprovided the best results in
terms of precision, although its recall was below average. From the last year
partic-ipants,XMapand MaasMatchimproved considerably their performance with respect
to both runtime and F-measure.AMLand LogMapobtained again very good results.
LogMap-Bio improvesLogMap’s recall in both tasks, however precision is damaged
Task 3: small FMA and SNOMED fragments
System Time (s) # Corresp. Scores Incoherence
Prec. F-m. Rec. Unsat. Degree
AML 126 6,791 0.93 0.82 0.74 0 0.0% LogMap-Bio 1,060 6,444 0.93 0.81 0.71 0 0.0% LogMap 63 6,242 0.95 0.80 0.70 0 0.0% XMap 35 7,443 0.86 0.79 0.74 13,429 56.9% LogMap-C 119 4,536 0.96 0.66 0.51 0 0.0% MaasMatch 4,605 8,117 0.65 0.66 0.67 21,946 92.9% Average 839 5,342 0.87 0.64 0.55 4,578 19.4% LogMapLite 13 1,645 0.97 0.34 0.21 773 3.3% OMReasoner 691 1,520 0.71 0.26 0.16 478 2.0%
Task 4: whole FMA ontology with SNOMED large fragment
System Time (s) # Corresp. Scores Incoherence
Prec. F-m. Rec. Unsat. Degree
AML 251 6,192 0.89 0.75 0.65 0 0.0% LogMap 388 6,141 0.83 0.71 0.62 0 0.0% LogMap-Bio 1,449 6,853 0.76 0.70 0.65 0 0.0% Average 523 5,760 0.79 0.62 0.54 11,823 5.9% LogMap-C 571 4,630 0.85 0.61 0.48 98 0.049% XMap 390 8,926 0.56 0.59 0.63 66,448 33.0% LogMapLite 90 1,823 0.85 0.33 0.21 4,393 2.2%
Table 10. Results for the FMA-SNOMED matching problem.
Note that efficiency in Task 2 has decreased with respect to Task 1. This is mostly due to the fact that larger ontologies also involves more possible candidate alignments and it is harder to keep high precision values without damaging recall, and vice versa.
Furthermore,AOT,AOTL,RSDLWBandMaasMatchcould not complete Task 2. The
first three did not finish in less than 10 hours whileMaasMatchrose an “out of memory”
exception.
6.6 Results for the FMA-SNOMED matching problem
Table 10 summarizes the results for the tasks in the FMA-SNOMED matching problem.
AMLprovided the best results in terms of F-measure on both Task 3 and Task 4.AML
also provided the best Recall and Precision in Task 3 and Task 4, respectively; while
LogMapLiteprovided the best Precision in Task 3 andLogMap-Bio the best Recall in
Task 4.
Overall, the results were less positive than in the FMA-NCI matching problem. As in the FMA-NCI matching problem, efficiency also decreases as the ontology size
increases. The most important variations were suffered byLogMapLite andXMap in
terms of precision. Furthermore,AOT,AOTL,RSDLWBcould not complete neither Task
3 nor Task 4 in less than 10 hours.MaasMatchrose an “out of memory” exception in
Task 5: small SNOMED and NCI fragments
System Time (s) # Corresp. Scores Incoherence
Prec. F-m. Rec. Unsat. Degree
AML 831 14,131 0.92 0.81 0.72 ≥0 ≥0.0% LogMap-Bio 1,379 14,360 0.88 0.79 0.71 ≥23 ≥0.031% LogMap 263 14,011 0.89 0.78 0.70 ≥23 ≥0.031% XMap 182 14,223 0.85 0.75 0.66 ≥65,512 ≥87.1% Average 1,522 12,177 0.91 0.72 0.61 ≥23,078 ≥30.7% LogMapLite 76 10,962 0.95 0.71 0.57 ≥60,426 ≥80.3% LogMap-C 2,723 10,432 0.91 0.67 0.53 ≥0 ≥0.0% OMReasoner 5,206 7,120 0.98 0.55 0.38 ≥35,568 ≥47.3%
Task 6: whole NCI ontology with SNOMED large fragment
System Time (s) # Corresp. Scores Incoherence
Prec. F-m. Rec. Unsat. Degree
AML 497 12,626 0.91 0.76 0.65 ≥0 ≥0.0% LogMap-Bio 2,545 12,507 0.85 0.70 0.60 ≥37 ≥0.020% LogMap 917 12,167 0.86 0.70 0.59 ≥36 ≥0.019% XMap 490 12,525 0.84 0.69 0.58 ≥134,622 ≥71.1% Average 1,181 12,024 0.86 0.69 0.57 ≥47,578 ≥25.1% LogMapLite 89 12,907 0.80 0.66 0.57 ≥150,776 ≥79.6% LogMap-C 2,548 9,414 0.88 0.61 0.46 ≥1 ≥0.001%
Table 11. Results for the SNOMED-NCI matching problem.
6.7 Results for the SNOMED-NCI matching problem
Table 11 summarizes the results for the tasks in the SNOMED-NCI matching problem.
AMLprovided the best results in terms of both Recall and F-measure in Task 5, while
OMReasonerprovided the best results in terms of precision. Task 6 was completely
dominated byAML.
As in the previous matching problems, efficiency decreases as the ontology size
increases. Furthermore,AOT,AOTL,RSDLWBcould not complete Task 5 nor Task 6 in
less than 10 hours.MaasMatchrose a ”stack overflow” exception in Task 5 and an “out
of memory” exception in Task 6, whileOMReasonercould not complete Task 6 within
the allocated time.
6.8 Summary results for the top systems
Table 12 summarizes the results for the systems that completed all 6 tasks of largebio track. The table shows the total time in seconds to complete all tasks and averages for Precision, Recall, F-measure and Incoherence degree. The systems have been ordered according to the average F-measure and Incoherence degree.
AMLwas a step ahead and obtained the best average Recall and F-measure, and
the second best average Precision.LogMap-Cobtained the best average Precision while
System Total Time (s) Average
Prec. F-m. Rec. Inc. Degree
AML 1,844 0.91 0.82 0.75 0.004% LogMap 1,751 0.89 0.79 0.72 0.013% LogMap-Bio 8,634 0.84 0.78 0.74 0.8% XMap 1,258 0.81 0.75 0.70 48.7% LogMap-C 6,331 0.91 0.69 0.56 0.013% LogMapLite 317 0.87 0.61 0.53 34.0%
Table 12. Summary results for the top systems.
Regarding alignment incoherence,AMLalso computed, on average, the
correspon-dence sets leading to the smallest number of unsatisfiable classes.LogMapvariants also
obtained very good results in terms of alignment coherence.
Finally,LogMapLitewas the fastest system. The rest of the tools were also very fast
and only needed between 21 and 144 minutes to complete all 6 tasks.
6.9 Conclusions
Although the proposed matching tasks represent a significant leap in complexity with respect to the other OAEI test cases, the results have been very promising and 6 systems completed all matching tasks with very competitive results. Furthermore, 11 systems completed at least one of the tasks.
There is, as in previous OAEI campaigns, plenty of room for improvement: (1) most of the participating systems disregard the coherence of the generated alignments; (2) the size of the input ontologies should not significantly affect efficiency, and (3) recall in the tasks involving SNOMED should be improved while keeping precision values.
The alignment coherence measure was the weakest point of the systems partici-pating in this test case. As shown in Tables 9-12, even highly precise alignment sets may lead to a huge number of unsatisfiable classes (e.g. LogMapLite and OMReasoner alignments in Task 5). The use of techniques to assess alignment coherence is critical if the input ontologies together with the computed alignments are to be used in practice. Unfortunately, only a few systems in OAEI 2014 have shown to successfully use such techniques. We encourage ontology matching system developers to develop their own repair techniques or to use state-of-the-art techniques such as Alcomo [23], the repair
module ofLogMap(LogMap-Repair) [17] or the repair module ofAML[29], which have
shown to work well in practice [19, 16].
7
MultiFarm
The MultiFarm data set [24] aims at evaluating the ability of matching systems to deal with ontologies in different natural languages. This data set results from the transla-tion of 7 Conference track ontologies (cmt, conference, confOf, iasted, sigkdd, ekaw and edas), into 8 languages: Chinese, Czech, Dutch, French, German, Portuguese, Rus-sian, and Spanish (+ English). These translations result in 36 pairs of languages. For
each pair, taking into account the alignment direction (cmten–confOfde and cmtde–
confOfen, for instance, as two distinct matching tasks), we have 49 matching tasks.
Hence, MultiFarm is composed of36 × 49 matching tasks.
7.1 Experimental setting
For the 2014 campaign, part of the data set has been used for a kind of blind evalua-tion. This subset include all the pairs of matching tasks involving the edas and ekaw
ontologies (resulting in36 × 24 matching tasks), which were not used in previous
cam-paigns10. We refer to evaluation as edas and ekaw based evaluation in the following.
Participants were able to test their systems on the freely available sub-set of match-ing tasks (open evaluation) (includmatch-ing reference alignments), available via the SEALS
repository, which is composed of36 × 25 tasks.
We can distinguish two types of matching tasks in MultiFarm : (i) those tasks where two different ontologies (cmt–confOf, for instance) have been translated into different languages; and (ii) those tasks where the same ontology (cmt–cmt, for instance) has been translated into different languages. For the tasks of type (ii), good results are not directly related to the use of specific techniques for dealing with ontologies in different natural languages, but on the ability to exploit the fact that both ontologies have an identical structure.
This year, only 3 systems (out of 14 participants, see Table 2) use specific
cross-lingual11 methods:AML,LogMap andXMap. This number drastically decreased with
respect to the last two campaigns: 7 systems in 2013 and 7 in 2012. All of them integrate
a translation module in their implementations.LogMap uses Google Translator API
and pre-compiles a local dictionary in order to avoid multiple accesses to the Google
server within the matching process.AMLandXMapuse Microsoft Translator, andAML
adopts the same strategy ofLogMapcomputing a local dictionary. The translation step
is performed before the matching step itself.
7.2 Execution setting and runtime
The systems have been executed on a Debian Linux VM configured with four pro-cessors and 20GB of RAM running under a Dell PowerEdge T610 with 2*Intel Xeon Quad Core 2.26GHz E5607 processors, under Linux ProxMox 2 (Debian). With respect to runtime, we compare all systems on the basis of the open data set and their runtimes
10
In fact, this subset was, two years ago, by error, available on the MultiFarm web page. Since that, we have removed it from there and it is not available as well for the participants via the SEALS repositories. However, we cannot guarantee that the participants have not used this data set for their tests.
11
As already reported in the last campaign, we have revised the definitions of multilingual and cross-lingual matching. Initially, as reported in [24], MultiFarm was announced as a bench-mark for multilingual ontology matching, i.e., multilingual in the sense that we have a set of ontologies in 8 languages. However, it is more appropriate to use the term cross-lingual on-tology matching. Cross-lingual onon-tology matching refers to the matching cases where each ontology uses a different natural language (or a different set of natural languages) for entity naming, i.e., the intersection of sets is empty. It is the case of matching tasks in MultiFarm.
can be found in Table 13. All measurements are based on a single run. Systems not listed
in Table 13 have not been executed in this track –InsMT,InsMTL,RiMOM-IM(dedicated
to the IM track) andLogMapBio(dedicated to LargeBio track) – or have encountered
problems to parse the ontologies (OMReasoner). Some exceptions were observed for
MaasMatch, which was not able to be executed under the same setting than the other
systems. Thus, we do not report on execution time for this system.
We can observe large differences between the time required for a system to complete
the36 × 25 matching tasks. WhileAMLtakes around 8 minutes,XMaprequires around
24 hours. Under a same settingLogMaptook around 18 minutes in 2013 and around
2 hours this year. This is due to the fact that the local dictionaries are incomplete and accesses to Google Translator server have to be performed for some pairs, what may explain the increase in the execution time.
7.3 Evaluation results
Open evaluation results Before discussing the results for the edas and ekaw based
evaluation, we present the aggregated results for the open subset of MultiFarm, for the test cases of type (i) and (ii) (Table 13). The results have been computed using the Alignment API 4.6. We did not distinguish empty and erroneous alignments. We observe significant differences between the results obtained for each type of matching task, specially in terms of precision, for all systems, with lower differences in terms of recall. As expected, all systems implementing specific cross-lingual techniques generate the best results for test cases of type (i). A similar behavior has also been observed for the tests cases of type (ii), even if the specific strategies could have less impact due to the fact that the identical structure of the ontologies could also be exploited instead by the
other systems. For cases of type (i), whileLogMaphas the best precision (at the expense
of recall),AMLhas similar results in terms of precision and recall and outperforms the
other systems in terms of F-measure (what is the case for both types of tasks).
Type (i) Type (ii)
System Time Size Prec. F-m. Rec. Size Prec. F-m. Rec.
AML 8 11.40 .57 .54 .53 54.89 .95 .62 .48 LogMap 128 5.04 .80 .40 .28 36.07 .94 .41 .27 XMap 1455 110.79 .31 .35 .43 67.75 .76 .50 .40 AOT 21 106.29 .02 .04 .17 109.79 .11 .12 .12 AOTL 48 1.86 .10 .03 .02 2.65 .27 .02 .01 LogMap-C 25 1.30 .15 .04 .02 3.52 .31 .02 .01 LogMapLite 6 1.73 .13 .04 .02 3.65 .25 .02 .01 MaasMatch - 3.16 .27 .15 .10 7.71 .52 .10 .06 RSDLWB 18 1.31 .16 .04 .02 2.41 .34 .02 .01
Table 13. MultiFarm aggregated results per matcher (average), for each type of matching task – different ontologies (i) and same ontologies (ii). Time is measured in minutes (time for
complet-ing the36 × 25 matching tasks). Size indicates the average of the number of generated
With respect to the specific pairs of languages for test cases of type (i), for the sake of brevity, we do not detail them here. The reader can refer to the OAEI results web page for detailed results for each of the 36 pairs of languages. As expected and al-ready reported above, systems that apply specific strategies to match ontology entities described in different natural languages outperform all other systems. As already
ob-served for the best system last year (YAM++), the best results in terms of F-measure for
AMLhas been observed for the pairs involving Czech – cz-en (.63), cz-ru (.63), cz-es
(.61), cz-nl (.60) – followed of pairs involving English and Russian – en-ru (.60). In the
case ofLogMap, for pairs involving English, Spanish – en-es (.61) – and Czech – cz-en
(.60) – it generates its best scores, followed by en-pt (.56) and de-en (.56). AsAML,
top F-measure results forXMapare observed for the pair involving Czech – cz-es (.50),
cz-fr (.47), cz-pt (.46). However, when dealing with cases of type (ii), these systems generate best results for the pairs involving English, French, Portuguese and Spanish
(including Dutch forLogMap).
For non-specific systems, most of them cannot deal with Chinese and Russian
lan-guages. All of them generate their best results for the pairs es-pt and de-en:AOT(es-pt
.10),AOTL(de-en .19),LogMap-C(de-en .20),LogMapLite(es-pt .23)MaasMatch
(de-en .37) andRSDLWB(es-pt .23), followed by es-fr, en-es and fr-nl. These systems take
advantage of similarities in the vocabulary for these languages in the matching task, in the absence of specific strategies. A similar result has been observed last year for non-specific systems, where 7 out of 10 cross-lingual systems generated their best results for the pair es-pt, followed by the pair de-en. On the other hand, although it is likely harder to find correspondences between cz-pt than es-pt, for some systems Czech is present in
the top-5 F-measure (cz-pt, forLogMap-C,LogMapLiteandRSDLWBor cz-es forAOTL,
LogMapLiteandRSDLWB). It can be explained by the specific way systems combine
their internal matching techniques (ontology structure, reasoning, coherence, linguistic similarities, etc).
Edas and Ekaw based evaluation In the first year of MultiFarm evaluation, we have used a subset of the whole data set, where we omitted the ontologies edas and ekaw, and suppressed the test cases where Russian and Chinese were involved. Since 2012, we have included Russian and Chinese translations, and this year we have included edas and ekaw in a (pseudo) blind setting, as explained above. We evaluate this subset on the systems implementing specific cross-lingual strategies. The tools run in the SEALS
platform using locally stored ontologies. Table 14 presents the results forAML and
LogMap. Using this setting,XMaphas launched exceptions for most pairs and its results
are not reported for this subset. These internal exceptions were due to the fact that the system exceeded the limit of accesses to the translator and could not generate any
translation for most pairs. WhileAMLincludes in its local dictionaries the automatic
translations for the two ontologies, it is not the case forLogMap(real blind case). This
can explain the similar results obtained byAMLin both settings. However,LogMaphas
encountered many problems for accessing Google translation server from our server, what explain the decrease in its results and the increase in runtime (besides the fact that this data set is slightly bigger than the open data set in terms of ontology elements).
Overall, for cases of type (i) – remarking the particular case ofAML – the systems maintained their performance with respect to the open setting.
Type (i) Type (ii)
System Time Size Prec. F-m. Rec. Size Prec. F-m. Rec.
AML 14 12.82 .55 .47 .42 64.59 .94 .62 .46
LogMap 219 5.21 .77 .33 .22 71.13 .19 .14 .11
Table 14. MultiFarm aggregated results per matcher for the edas and ekaw based evaluation, for each type of matching task – different ontologies (i) and same ontologies (ii). Time, in minutes,
for completing the36 × 24 matching task.
Comparison with previous campaigns In the first year of evaluation of MultiFarm (2011.5 campaign), 3 participants (out of 19) used specific techniques. In 2012, 7 sys-tems (out of 24) implemented specific techniques for dealing with ontologies in differ-ent natural languages. We had the same number of participants in 2013. This year, none of these systems has participated. However, we count with 3 systems implementing
cross-lingual strategies (AML,LogMap andXMap), as extensions of versions
partici-pating in previous campaigns. Comparing 2013 and 2012 F-measure results (on the
same basis - type (ii)), this yearAML(.54) outperformed the best system in 2013 and
2012 –YAM++(.40) – whileLogMap(.40) had similar results. In overall, we observe a
global improvement in performance this year for systems implementing specific
match-ing strategies. With respect to non-specific systems,MaasMatchincreased F-measure
for tests of type (i) – from .01 up to .15 – and decreased that of cases (ii) – .29 to .10. Its good performance in (ii) may be explained by the implementation of new similarity aggregations reflecting similarity values even when few overlaps exist.
7.4 Conclusion
As we could expect, systems implementing specific methods for dealing with ontologies in different languages outperform non specific systems. However, since the first cam-paign MultiFarm is proposed, the absolute results are still not very good, if compared to the top results of the original Conference data set (approximatively 74% F-measure for the best matcher). Although only 3 systems have implemented specific strategies this year, in terms of overall results, one of them has outperformed the best systems in previous campaigns. However, the adopted strategies are rather limited to translations steps before the matching step itself. Again, all systems privilege precision rather than recall. Both in terms of matching strategies and results, there is still room for improve-ments. As future work, we plan to provide a new version of the data set, correcting as well some typos identified in the translations. We envisage as well to add the Italian translations as (real) blind evaluation.
8
Library
The library test case was established in 201212. The test case consists of matching two
real-world thesauri: The Thesaurus for the Social Sciences (TSS, maintained by GESIS) and the Standard Thesaurus for Economics (STW, maintained by ZBW). The reference alignment is based on a manually created alignment in 2006. As additional benefit from this test case, the reference alignment is constantly updated by the maintainers with the generated correspondences that are checked manually when they are not part of the
reference alignment.13
8.1 Test data
Both thesauri used in this test case are comparable in many respects. They have roughly the same size (6,000 resp. 8,000 concepts), are both originally developed in German, are both translated into English, and, most important, despite being from two different domains, they have significant overlapping areas. Not least, both are freely available
in RDF using SKOS.14 To enable the participation of all OAEI matchers, an OWL
version of both thesauri is provided, effectively by creating a class hierarchy from the concept hierarchy. Details are provided in the report of the 2012 campaign [1]. For the first time, we also created an OWL version containing SKOS annotations like preferred and alternative label as OWL annotations. As stated above, we updated the reference alignment with all correct correspondences found during the last campaigns. It now consists of 3161 correspondences.
8.2 Experimental setting
All matching processes have been performed on a Debian machine with one 2.4GHz core and 7GB RAM allocated to each system. The evaluation has been executed by using the SEALS infrastructure. Each participating system uses the OWL version, two systems make use of the additional SKOS annotations.
To compare the created alignments with the reference alignment, we use the Alignment API. For this evaluation, we only included equivalence relations
(skos:exactMatch). We computed precision, recall and F1-measure for each matcher.
Moreover, we measured the runtime, the size of the created alignment, and checked whether a 1:1 alignment has been created. To assess the results of the matchers, we developed three straightforward matching strategies, using the original SKOS version of the thesauri:
– MatcherPrefDE: Compares the German lower-case preferred labels and generates a correspondence if these labels are completely equivalent.
– MatcherPrefEN: Compares the English lower-case preferred labels and generates a correspondence if these labels are completely equivalent.
12There has already been a library test case from 2007 to 2009 using different thesauri, as well
as other thesaurus test cases like the food and the environment test cases.
13With the reasonable exception of XMapGen, which produces almost 40.000 correspondences.
– MatcherPref: Creates a correspondence, if either MatcherPrefDE or Matcher-PrefEN or both create a correspondence.
– MatcherAllLabels: Creates a correspondence whenever at least one label (preferred or alternative, all languages) of an entity is equivalent to one label of another entity.
8.3 Results
Of all 12 participating matchers (or variants), 7 were able to generate an alignment within 8 hours. The results can be found in Table 15.
Matcher Precision F-Measure Recall Time (ms) Size 1:1
AML* 0.82 0.80 0.78 68489 2983 -MatcherPref 0.91 0.74 0.63 - 2190 -AML 0.72 0.73 0.75 71070 3303 -MatcherPrefDE 0.98 0.73 0.58 - 1885 -MatcherAllLabels 0.61 0.72 0.89 - 4605 -LogMap* 0.74 0.71 0.68 222668 2896 -LogMap 0.78 0.71 0.65 73964 2642 -LogMapLite 0.64 0.70 0.77 9329 3782 -XMap2 0.51 0.65 0.89 12652823 5499 -MatcherPrefEN 0.88 0.57 0.42 - 1518 -MaasMatch 0.50 0.57 0.66 14641118 4117 x LogMap-C 0.48 0.34 0.26 21859 1723 -RSDLWB 0.78 0.07 0.04 32828314 155 x
Table 15. Results of the Library test case (ordered by F-measure).
The best systems in terms of F-measure areAMLandLogMap.AML* andLogMap*
are the matching systems performed on the OWL-dataset with SKOS annotations. For both systems, using this ontology version increases the F-measure up to 7% which
shows that the additional information is useful. Except forAML, all systems are below
the MatcherPrefDE and MatcherAllLabels strategies. A group of matchers including
LogMap,LogMapLite, and XMap2 are above the MatcherPrefEN baseline. Compared to
the evaluation conducted last year, the results are similar: The baselines with preferred
labels are still very good and can only be beaten by one system.AML* has a better
F-Measure than any other system before (4% increase compared to the best matcher of last year).
Like in previous years, an additional intellectual evaluation of the alignments estab-lished automatically was done by a domain expert to further improve the reference alignment. Since the competing ontology matching tools predominantly apply lexi-cal approaches for matching the two vocabularies they foremost establish new cor-respondences on the character level. The main approaches that are applied here are Levenshtein distance or string recognition where character strings could consist of up to a whole part of a compound word, partly used as an adjective. Together with the three above described straightforward matching strategies, these character respec-tively string matching approaches lead to different types of systematic mismatches. Especially in the case of short terms, Levensthein distance could lead to wrong cor-respondences, e.g., “Ziege” (Eng. goat) and “Zeuge” (Eng. witness) or “Dumping”


![Table 7. The highest average F [0.5|1|2] -measure and their corresponding precision and recall for each matcher with its F 1 -optimal threshold (ordered by F 1 -measure)](https://thumb-eu.123doks.com/thumbv2/123doknet/3285647.94276/15.892.217.682.533.750/highest-average-measure-corresponding-precision-matcher-optimal-threshold.webp)