REPUBLIQUE ALGERIENNE DEMOCRATIQUE ET POPULAIRE
MINISTERE DE L’ENSEIGNEMENT SUPERIEUR ET DE LA
RECHERCHE SCIENTIFIQUE
Université Ferhat ABBAS –
Sétif-1-T
T
H
H
È
È
S
S
E
E
Présentée à la Faculté de Technologie
Département de Génie des Procédés
pour l'obtention du diplôme de
D
D
O
O
C
C
T
T
O
O
R
R
A
A
T
T
E
E
N
N
S
S
C
C
I
I
E
E
N
N
C
C
E
E
S
S
Option : Génie des polymères
Par
Mohammed BOUCHAKOUR
Thème
Irradiation Polymerization of
Polypropyleneglycoldiacrylates/Liquid Crystal E7 Systems
Soutenue le 28/11/2016 devant un Jury composé de:
Nacerddine. HADDAOUI Professeur à l'université Ferhat Abbas, Sétif-1 Président
Farid. RIAHI Professeur à l'université Ferhat Abbas, Sétif-1 Directeur de thèse Ulrich MASCHKE
Djafer. BENACHOUR
Directeur de Recherche, Université Lille 1 Professeur à l'université Ferhat Abbas, Sétif-1
Co-directeur de thèse Examinateur
Kamel CHAOUI Professeur à l'université Badji Mokhtar, Annaba
Examinateur
Toufik BOUCHAOUR Professeur à l'université Abou Bekr Belkaid Tlemcen
Examinateur
Dedication
I would like to dedicate the present work to my father and
mother, my sisters and brothers.
To the memory of my father in law, to my mothers in law, my
sisters and brothers in law
I wish also to dedicate this work to my wife Wahiba, my sons
Anes Attia, Moadh Tayeb and Mohammed Farid, and…
Aknowledgments
I would like to thank deeply my two advisors, Pr. Farid RIAHI and Dr. Ulrich MASCHKE , for all their patience, instructions, moral support and encouragement.
During the years of 2011 to 2013, I got a PROFAS scholarship from the Algerian ministry of higher education and scientific reasurch to accomplish a deep PhD reasurch about Liquid crystals and Polymer dispersed liquid crytals PDLC’s at the Unité Materiaux et Transformations “UMET” of the University of Sciences and Technology of Lille1. I would like to express my gratitude to all of them.
I would like to thank some Scientific Staff of UMET for their considerable help and freindship.
My gratitude are expressed to the members of the jury mamely Pr. N. Haddaoui, Pr. Dj. Benachour, Pr. K. Chaoui, Pr. T. Bouchaour and Pr. M. Bakar who accepted to judge this work.
I received a lot of help from Dr. Christophe BEYENS, Dr. Mohammed Makhloufia, Dr. Yazid Derouiche, Dr. Ammar Elqidrea, Dr. Guy Joel, Dr. K. Bouraa, Dr. Nouria Bouchikhi, Ahmed Touati, Sofiane Bedjaoui, I would like to thank all of them for their assistance and helpful discussions.
Special gratitude to my family, especially my parents, for their long-term support and encouragement. I would like to use my dissertation as a special gift to my lovely sons.
Abstract:
This contribution focuses on a detailed investigation of the relationship between the methods of polymerization/cross-linking, such as slow and rapid UV radiation, and high voltage accelerated electron beam (EB), and the resulting physical properties including phase diagrams, polymerization and phase separation kinetics, morphologies, thermal properties and electro-optical responses of polypropyleneglycoldiacrylate (PPGDA800) and tripropyleneglycoldiacrylate (TPGDA) monomers, in the presence of the nematic liquid crystal E7, used to prepare a polymer dispersed liquid crystal (PDLC). Based on the phase diagrams obtained by polarized optical microscopy, 60wt.% E7 was found to be the limit of solubility of the LC in PPGDA800. The longer the spacing between the double bonds in PPGDA800, the more rapid was the photopolymerization under both UV systems; nevertheless, the opposite was proved under EB. More homogenous and regular morphologies were obtained under the more homogeneous EB curing; whereas, irregular ones resulted under the heterogeneous photopolymerization.
The electro-optical responses of various polymer dispersed liquid crystals (PDLCs) systems exhibited remarkable differences between the UV-cured samples and those cured by the EB technique. It was found that the threshold and saturation voltages considerably increased in the case of the UV-cured systems. Other results involving the contrast ratio, which is higher for EB-cured systems, confirm their higher quality, although the rapid photopolymerization UV source was employed, which slightly improved the electro-optical responses. Moreover, EB curing leads to high enough conversions without a photoinitiator, which may act as an impurity that might have a strong impact on the electro-optical performance and also lead to the discoloration of the obtained PDLCs.
Keywords: PDLC; polypropyleneglycoldiacrylate; E7; liquid crystal; photopolymerization;
i Contents: Dedication……….. Aknowlegments ……… Abstract ………. Table of contents……… List of tables………... List of figures………. Introduction……… References……….
Chapter 1. Liquid crystals...
1. Historical Aspect of LC’s... 2. Definition of Liquid Crystals... 3. Classification of Liquid Crystals... 3.1. Nematic... 3.2. Smectic... 3.3. Cholesteric... 4. Types of Liquid Crystals... 4.1. Thermotropic Liquid Crystals... 4.2. Lyotropic Liquid Crystals... 5. Eutectic Mixtures of Liquid Crystals... 6. Properties of Liquid Crystals... 6.1. Order Parameter... 6.2. Optical Anisotropy or Birefringence... 6.3. Dielectric Anisotropy... 6.4. Elasticity... 7. Phase Diagrams of Liquid Crystal/Monomer blends... References………..
Chapter 2. Polymer dispersed liquid crystals………...
1. PDLC Preparation Techniques………..……… 1.1. Emulsion Technique………... 1.2. Phase Separation Technique... 1.2.1. Solvent-induced Phase Separation... 1.2.2. Temperature-induced Phase Separation... 1.2.3. Polymerization-induced Phase Separation... 1.2.3.1. Photopolymerization... a. Steady State Kinetics of Linear Photopolymerization... b. Kinetics of Crosslinking Photopolymerization... 1.2.3.2. Polymerization by Accelerated Electron Beams... 1.2.3.3. Comparison between EB and UV curing... 2. Properties of PDLC’s... 2.1. Electro-optical Properties of PDLC’s... 3. Applications of PDLC’s………. 3.1. Smart Windows... Conclusion... References……….. i iv v 2 4 8 8 10 10 10 10 10 11 11 13 14 16 16 17 19 20 21 24 27 27 27 28 28 28 28 29 31 33 35 36 37 37 42 42 43 43
ii
Chapter 3. Experimental work...
1. Raw Materials... 2. Sample Preparation... 2.1. Elaboration Techniques... 2.1.1. UV Curing... 2.1.2. EB Curing... 3. Characterization Methods... 3.1. Optical Methods... 3.1.1. Polarised Optical Microscopy... 3.1.2. Scanning Electron Microscopy... 3.2. Spectroscopic Methods... 3.2.1. Fourier Transform Infrared Spectroscopy... 3.2.2. Nuclear Magnetic Resonance Spectroscopy... 3.3. Thermal Methods... 3.3.1. Thermo Gravimetric Analysis... 3.3.2. Differential Scanning Calorimetry... 3.4. Electro-optical Measurements... References...
Chapter 4. Results and discussion...
1. Analysis of Raw Materials... 1.1. Spectroscopic Methods... 1.1.1. FTIR Analysis... 1.1.2. NMR Spectroscopy... 1.2. Thermal Methods... 1.2.1. Thermo Gravimetric Analysis TGA... 2. Analysis of Monomers/LC E7 Mixtures... 2.1. Phase Diagrams ... 3. Analysis of PDLC Systems... 3.1. Infrared Spectroscopy... 3.2. Morphologies... 3.2.1. Morphology by POM... 3.2.2. Morphology by SEM... 3.3. Thermal Properties by DSC... 3.4. Electro-optical Responses... References……….. General Conclusions……….. Recommendations………. 47 47 48 48 48 50 51 51 51 51 52 52 54 54 54 54 56 57 59 59 59 59 62 65 65 68 68 70 70 74 74 76 77 82 85 88 91
iii
List of tables
1-1: Transition temperatures of the alkylcynobiphenyls nCB... 4-1: IR band designations for TPGDA andPPGDA800... 4-2: IR band designation of the LCE7... 4-3: 1H NMR results of PPGDA800... 4-4:1H NMR results of TPGDA... 4-5: Transition temperatures in the neat, photopolymerized TPGDA and PPGDA800 with or without 60wt.%E7...
13 61 62 64 65 81
iv
List of figures:
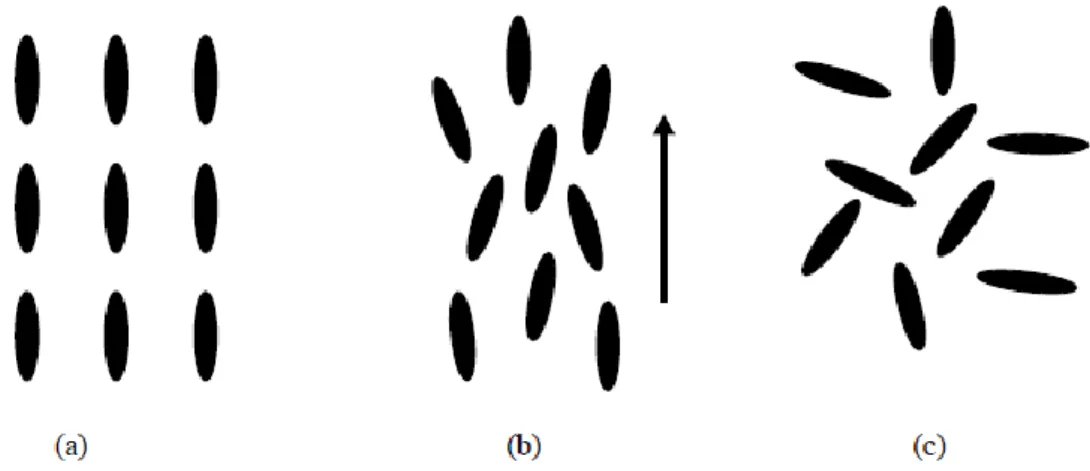
1-1: Schematic description of (a) crystal, (b) liquid crystal and (c) liquid...8
1-2:The chemical composition of 4'-n-heptyl-4-cyano-biphenyl known as 7CB...9
1-3: Phase sequence of three organic substances; (a) n-heptane, (b) 4-cyanobiphenyl, (c) 7CB (4'-n-heptyl-4-cyano-biphenyl)...9
1-4: An example of cholestric molecule: 3-methyl 4'-hexyl 4-cyanobiphenyl...11
I-5: Schematic description of mesogenic phases: (a) nematic, (b) smectic A, (c) smectic C, (d) cholestric...11
1-6: Polymorphisms of the corresponding series nCB and nOCB...13
1-7: Examples of some amphiphilic phospholipid molecules...15
1-8: Theoretical phase diagram for the 5CB/7CB blend computed from the Schroder-van Laar law...17
1-9: Definition of θ used in equation (5)...17
1-10: Variation of the order parameter S with temperature T...18
1-11: A graphical illustration of optical anisotropy or birefringence...18
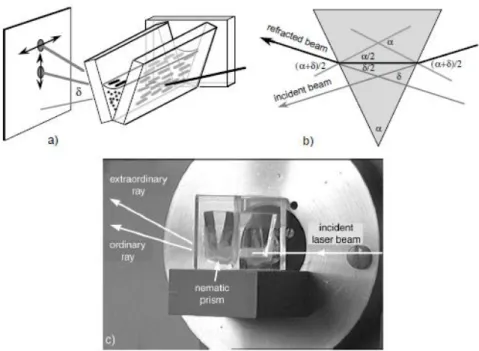
1-12: a) Experimental evidence for nematic phase birefringence; two rays linearly polarized with a 90° difference exit the prism; b) measuring the angle of least deviation; c) photograph of the experimental setup...19
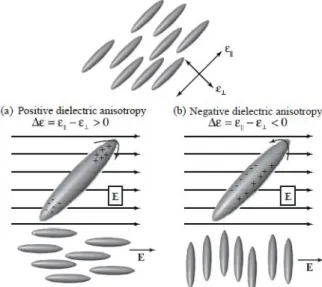
1-13: A graphical illustration of (a) positive and (b) negative dielectric anisotropy...21
1-14: Splay, twist, and bend elastic constants...21
1-15: Phase diagram for uncured E7/NOA65 mixtures………....24
1-16: Measured and calculated mixing temperatures for uncured E7/NOA65 system. Points are Tmix values from Figure 1-15. Solid line is FH binodal curves; dashed line is corresponding spinodal curve. C, D: parameters of Eq. (3), m1, m2: number of sites occupied by LC and polymer segment (in Eq. (2), respectively, r1 and r2)……….25
2-1: The decomposition of 2-hydroxy-2-methyl-1-phenyl-propane- 1-one (Darocur 1173), X is an OH group...30
2-2: Photoinitiated crosslinking polymerisation of a diacrylate monomer. PI is an abbreviation for the photoinitiator...31
2-3: Conversion Vs exposure time (solid line) and Rp Vs exposure time (dashed line) recorded by RTIR upon UV curing of a polyurethane acrylate at light intensity: 30 mW/ cm2...38
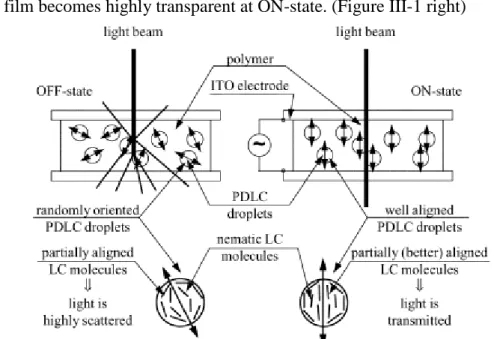
v 2-4: Schematic representation of a PDLC light shutter in the OFF-state (left) and when a low frequency electric field is applied across it (ON-state, right). Double arrows are a schematic
representation of the droplet director...39
2-5: a typical PDLC film: a) at the OFF-state, b) at the ON-state, c) when electric field is removed...39
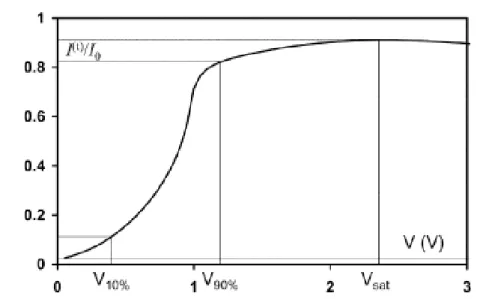
2-6: Typical behaviour of the light intensity transmitted by a PDLC film...40
2.7: Common nematic director configurations: (a) bipolar, (b) radial, (c) toroidal, (d) axial...42
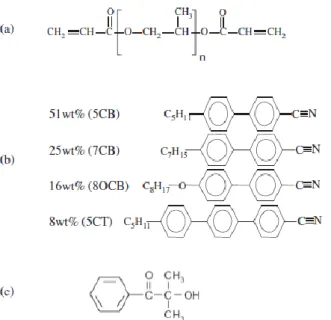
3-1: Chemical structures of (a) polypropyleneglycoldiacrylate (PPGDA) monomers, (b) nematic LC E7 mixture and (c) photoinitiator: 2-hydroxy-2-methyl-1-phenyl-propane-1-one (Darocur 1173)...49
3-2: The UV light source TL08 used...49
3-3: the lamp Philips TL08 spectrum...50
3-4: Photo of the dosimeter used...50
3-5: The Dr. Hönle UV lamp (UVH medium-pressure mercury arc lamp)...51
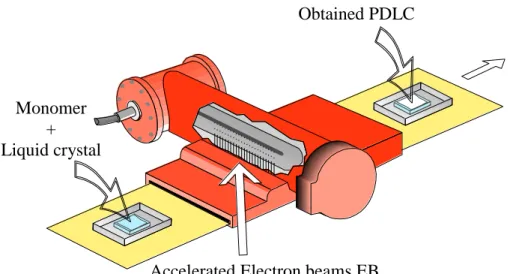
3-6: Scheme of Electron Beam EB process...51
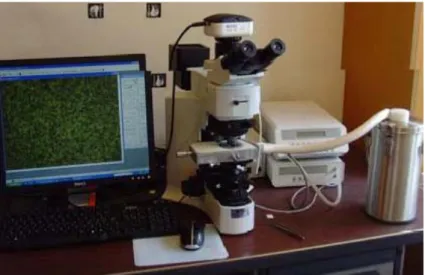
3-7: The Olympus BX-41 model; polarizing optical microscope POM...52
3-8: Schematic diagram of a scanning electron microscope...53
3-9: Sample preparation for the polymerization...53
3-10: Double bond absorbance, before and after polymerization...53
3-11: (a): NMR Bruker AC300, (b): NMR tube...54
3-12: An electro-optical bench...56
3-13: The manner of applying the voltage...57
4-1: FTIR spectrum of TPGDA...59
4-2: FTIR spectra of TPGDA and PPGDA800...60
4-3: FTIR spectrum of LC E7...61
4-4: The chemical structures of TPGDA (n=3) and PPGDA800 (n=12)...62
4-5: 1H NMR spectrum of PPGDA800 (n=12)...63
4-6: 1H NMR spectrum of TPGDA (n=3)...64
4-7: TGA thermograms of TPGDA and PPGDA800...66
4-8: TGA thermograms of TPGDA and PPGDA800 from 450 to 600°C...66
4-9: TGA thermograms of neat TPGDA and that of photopolymerized TPGDA (under UV-TL08 for about 10min)...67
vi 4-10: Phase diagrams of the monomeric mixtures: PPGDA800/E7 (squared symbols) and TPGDA /E7 (triangular symbols)...68 4-11: Morphologies of monomeric PPGDA800/E7 mixtures obtained from POM at T = 20°C: (a) 60 wt %, (b) 70 wt % and (c) 80 wt % E7...69 4-12: Variation of acrylic double bonds Conversion for TPGDA and PPGDA800, TPGDA/60 wt % E7 and PPGDA800/60 wt % E7as a function of exposure time, prepared by (a) UV-TL08, (b) UV-Dr. Hönle system and (c) EB curing...73 4-13: Micrographs obtained by POM; UV-TL08: (a) PPGDA800/60 wt % E7; (b) TPGDA/60 wt % E7. UV-Dr. Hönle system: (c) PPGDA800/60 wt % E7; (d) TPGDA/60 wt % E7; and EB curing: (e) PPGDA800/60 wt % E7; (f) TPGDA/60 wt % E7...75 4-14: SEM microphotographs of a: PPGDA800/60 wt. % E7 and b: TPGDA/60 wt. % E7....76 4-15: DSC thermograms of the photopolymerized samples under UV-TL08 a:TPGDA for about 10min, b: TPGDA/60 wt.% E7 for about 05min...77 4-16: DSC thermograms of photopolymerized films under UV-TL08 of PPGDA800 for about 02min (blue line), PPGDA800/60 wt.% E7 for about 05min (black line)...78 4-17: DSC thermogram of LC E7...79 4-18: Electro-optical responses of 17µm thick TPGDA/60wt.%E7 and PPGDA800/60wt.%E7 prepared by (a) UV-TL08; (b) UV-Dr Hönle system; and (c) EB curing...83 4-19: The electro-optical responses of 17-μm-thick samples elaborated by UV-Dr. Hönle system and UVTL08; (a) TPGDA/60 wt % E7 and (b) PPGDA800/60 wt % E7…...84
1
2
Introduction:
Most people have been trained, since their first years at school, that there are only three states of matter: solid, liquid and gas. In reality, a solid matter can be either crystalline or amorphous and the most important property which distinguishes liquids from solids is their ability to flow. Although the early investigators of the 19th century, among whom O. Lehmann, discovered other phases which did not necessarily fall into these categories, he called these substances flowing crystals and later on the term “liquid crystals” (LC) was coined by G. Freidel [1,2]. LC's were once considered as a rare state of matter, but up to now several thousands of liquid crystalline compounds have been actually synthesized. [3]
Liquid crystals are intermediate phases; their properties such as partial or no positional order, partial orientational order are intermediate between those of anisotropic liquids which do not have positional nor orientational order and those of crystals which exhibit both positional and orientational order. A liquid crystal is a material that couples most of the mechanical properties of a liquid including its high fluidity and inability to support shear with some electromagnetic properties such as a high electrical, magnetic and optical anisotropies of a crystal [4]. LC’s were known since the end of the 19th
century but their first applications in electro-optic devices appeared in the mid of the 20th century. In such applications, the most attractive properties concern the possibility of controlling the LC optical anisotropy by means of an electric or magnetic field but the liquid behavior remains an undesired characteristic. To find more useful materials some authors have used LC’s in compound materials such as droplets of a nematic material floating in an isotropic liquid or nematic LC confined in micrometer-sized cavities within a solid. Fergason in 1984 [5-6] and Doane et. al. [7-8] a few years later introduced a new class of composite materials constituted by small droplets of LC embedded in a polymeric film. The most current term used to describe these materials is PDLC which stands for ”polymer dispersed liquid crystal”. The introduction of PDLC’s allowed to combine the peculiar mechanical properties of a polymeric film with the electro-optical properties of LC’s, permitting hence the realization of many new applications such as flexible displays, smart windows, projection displays, sensors, etc [4,9] .
The preparation of these films is mainly based on phase separation induced by either polymerization (PIPS: polymerization induced phase separation), solvent evaporation (SIPS: solvent induced phase separation) or temperature reduction (TIPS: temperature induced phase separation) processes. The PIPS is the most widely used process through the use of either Electron Beams (EB), UV light or heat. The EB curing leads to high enough conversions
3 without a photoinitiator which may act as an impurity that might have a strong negative impact on the electro-optical performance of the obtained PDLC’s [10-11].
In the PIPS process, thiol-enes, epoxy, styrene, mono-, di-, and multifunctional acrylates and methacrylates are the basic monomers and prepolymers used to prepare PDLC’s. During the polymerization reaction, the liquid crystal becomes less miscible with the growing polymer, and finally, the mixture will separate into two phases; the polymer matrix presents the major phase and the droplets of confined liquid crystal molecules present the minor phase. A proper control of the phase separation phenomena of the polymer/liquid crystal composite system is necessary to obtain different morphologies, depending essentially on the polymerization conditions [12].
E. Andrzejewska [13], C. Decker et al.[14,15], T. Scherzer et al.[16], and K. S. Ansceth et al.[17] studied extensively the photopolymerization of multifunctional monomers. They found that it is a complicated process, especially with respect to reaction kinetics. The kinetics of network formation involve phenomena not observed in linear polymerizations, especially the immediate onset of autoacceleration and radical trapping at early stages as well as the dominance of reaction-diffusion as the means of migration of propagating radicals. In the later stages of polymerization, auto deceleration, or incomplete functional group conversion takes place because of the extremely low mobility of the propagating species in the crosslinked network.
B. Defoort et al. [18], C. Patacz et al.[19,20] U. Mashke et al.[21], W. Knolle et al.[22], have deeply studied the polymerization of Tripropyleneglycoldiacrylate (TPGDA) under accelerated electron beams. They found that EB-induced free radical polymerization of such acrylic monomer is considered to follow the same reaction scheme as for UV-induced polymerization. The main difference between the two initiation processes lies in the energy deposition and the pathway for free radical generation. EB networks are usually uniformly cured due to the fulldepth penetration of the electrons. Meanwhile, their UV counterparts tend to be less cured due to the photoinitiators which absorb more of the UV irradiation at the surface rather than in the core, resulting in the non-uniform polymer networks, especially for thick parts.
Motivation and organization of the thesis
The electro-optical properties of PDLC films have been the subject of several PhD and master theses at the laboratory of Ingénierie des Systèmes Polymères of UMET ( Unité Matériaux Et Transformation) at the university of Lille 1 (France) and some studies did elsewhere in the world [23-31]. It was found that such properties are controlled by several factors including
4 the type of LC and monomers or prepolymers, the method of preparation, film thickness, droplet morphology, configuration and surface anchoring.
Therefore and, for the sake of completeness, it is still important to continue the exploration of the relationship between the methods of polymerization, the polymerization and phase separation kinetics, the morphologies and the electro-optical responses of some systems which were previously performed at UMETof [25-27]. On the other hand, since no attempt has been made to compare between rapid UV and rapid EB radiations the objective of this study was to use two diacrylates of polypropyleneglycol based monomers; namely: tripropyleneglycoldiacrylate (TPGDA) and polypropyleneglycoldiacrylate (PPGDA800) having molecular weights of 300 and 800g/mole respectively in the presence of the E7 liquid crystal .These were cured via PIPS process by slow and rapid UV and EB radiations; the aim behind the use of very rapid UV process (UV-Dr. Hönle) was to check whether the steep electro-optical responses had been previously seen, at the laboratory “ingénierie des systèmes polymères” of UMET, in EB samples that could be obtained.
This thesis is composed of four chapters; the first two chapters present the theoretical background of liquid crystals, methods of preparation of polymer dispersed liquid crystals and their properties and applications. The third chapter concerns the materials used and presents the experimental sample preparation methods as well as the different testing procedures. Chapter four discusses the results of the phase diagrams, polymerization kinetics, thermal properties, morphologies and electro-optical properties.
It is hoped that this contribution would provide useful information and a comprehensive material of interest to both scientists and technologists.
References
[1] S. Singh, Liquid crystals fundamentals, World Scientific, Singapore, 2002.
[2] P. Oswald and P. Pieranski, Nematic and cholesteric liquid crystals concepts and physical properties, transl. by D. Constantin, Taylor & Francis CRC Press, New York, 2005.
[3] G. P. Crawford and S. J. Woltman, Liquid crystals: A unique phase of matter, Chapter 1 in, liquid crystals frontiers in biomedical applications, edit. by S. J. Woltman, G. P. Crawford and G. D. Jay, World Scientific, Singapore, 2007.
[4] F Bloisi and L Vicari, Polymer-dispersed liquid crystals, chapter 4 in , Optical applications of liquid crystals, Edit. by L Vicari, Institute of Physics Publishing, Bristol, UK: 185-210, 2003.
5 [5] J. L. Fergason, Encapculated liquid crystal and methods, US Patent 4 435 047, 1984. [6] J. L. Fergason, Polymer encapsulated liquid crystals for display and light control applications, Tech. Digest. SID Int. Symp.;85: 68-70, 1985.
[7] J. W. Doane, N. A. Vaz, B. G. Wu and S. Zumer, Field controlled light scattering from nematic microdroplets, Appl. Phys. Lett.; 48: 269-71, 1986.
[8] J. W. Doane, G. Chidichimo and N. A. Vaz, US Patent 4 688 900, 1987.
[9] J.P.F. Lagerwall, and G. Scalia, A new era for liquid crystal research: applications of liquid crystals in soft matter nano-, bio- and microtechnology. Curr. Appl. Phys.;12: 1387–12,
2012.
[10] M. Mucha, Polymer as an important component of blends and composites with liquid crystals, Progr. Polym. Sci.; 28: 837–73, 2003.
[11] Y. J. Jeon, Y. Bingzhu, J. T. Rhee, D. L. Cheung, and M. Jamil, Application and new developments in polymer-dispersed liquid crystal simulation studies, Macromol. Theory Simul.; 16: 643–59, 2007.
[12] P. S. Drzaik, Liquid crystal dispersion, Series on liquid crystals, World scientific, Singapore, 1995.
[13] E. Andrzejewska. Photopolymerization kinetics of multifunctional monomers. Prog Polym Sci.; 26: 605–65, 2001.
[14] C. Decker, Photoinitiated crosslinking polymerisation. Prog. Polym. Sci.; 21: 593–50,
1996.
[15] C. Decker, and B. Elzaouk, Photopolymérisation de monomères multifonctionnels—VII. Evaluation des constantes de vitesse de propagation et de terminaison. Eur. Polym. J.; 31: 1155–63, 1995.
[16] T. Scherzer, and U. Decker, The effect of temperature on the kinetics of diacrylate photopolymerizations studied by real-time FTIR spectroscopy, Polymer, vol. 41, pp. 7681– 7690, 2000.
[17] K. S. Anseth, C. M. Wang, and C. N. Bowman, Kinetic evidence of reaction-diffusion during the polymerization of multi(meth)acrylate monomers, Macromolecules; 27: 650–55,
1994.
[18] B. Defoort, D. Defoort, and X. Coqueret, Electron-beam initiated polymerization of acrylate compositions, 2. Simulation of thermal effects in thin films, Macromol. Theory Simul.; 9: 725–34, 2000.
6 [19] C. Patacz, B. Defoort, and X. Coqueret, Electron-beam initiated polymerization of acrylate compositions 1: FTIR monitoring of incremental irradiation, Rad. Phys. Chem.; 59: 329–37, 2000.
[20] C. Patacz, X. Coqueret, and C. Decker. Electron-beam initiated polymerization of acrylate compositions 3: compared reactivity of hexanediol and tripropyleneglycol diacrylates under UV or EB initiation. Rad. Phys. Chem.; 62: 403–10. 2001.
[21] U. Maschke, X. Coqueret, and C. Loucheux, Electron beam processing for polymerization induced phase separation: preparation of polymer dispersed liquid crystal films. Nucl. Instr. Meth. Phys. Res. Sec. B: Beam Interact with Mater Atoms; 105: 262–66,
1995.
[22] W. Knolle, and R. Mehnert, Primary reactions in the electron-induced polymerization of acrylates, Nucl. Instr. Meth. Phys. Res. Sec. B: Beam Interact. Mater. Atoms; 105: 154–58,
1995.
[23] U. Maschke, N. Gogibus, A. Traisnel, and X. Coqueret, Preliminary communication. Electron beam cured liquid crystal-polymer composite materials: electrooptical enhancement effect, Liq. Cryst.; 23: 457–61, 1997.
[24] U. Maschke, A. Traisnel, J. D. Turgis, and X. Coqueret, Influence of liquid crystal concentration on the electro-optical behavior of polymer dispersed liquid crystal films prepared by electron beam processing, Mol. Cryst. Liq. Cryst. Sci. Tech. Sec. A Mol. Cryst. Liq. Cryst.; 299: 371- 78, 1997.
[25] F. Z. Abdoune, L. Benkhaled, L. Méchernène, and U. Maschke, Investigation of the electro-optical behavior of UV cured polymer/liquid crystal systems. Phys. Procedia; 2: 643– 48, 2009.
[26] M. Kashima, H. Cao, Q. Meng, H. Liu, D. Wang, F. Li, and H. Yang, The influence of crosslinking agents on the morphology and electro-optical performances of PDLC films, J. Appl. Polym. Sci.; 117: 3434–40, 2010.
[27] Z. Yang, D. Li, C. Pan, and Y. Wang, Effects of hyperbranched prepolymers prepared from butyl acrylate and butyl methacrylate on the electro-optical properties of polymer dispersed liquid crystal, Polym. Adv. Technol.; 23: 1321–27, 2012.
[28] J. He, B. Yan, B. Yu, S. Wang, Y. Zeng, and Y. Wang, The effect of molecular weight of polymer matrix on properties of polymer-dispersed liquid crystals, Eur. Polym. J.; 43: 2745– 49, 2007.
7 [29] J. H. Ryu, S. G. Lee, J. B. Nam, and K. D. Suh, Influence of SMA content on the electro-optical properties of polymer-dispersed liquid crystal prepared by monodisperse poly(MMA-co-SMA)/LC microcapsules, Eur. Polym. J.; 43: 2127–2134, 2007.
[30] M. M. Dzhons, S. A. Bulgakova, I. A. Pantyukhina, and I. A. Kazantzeva. Effects of chemical structure and composition of the polymer matrix on the morphology and electro-optical performance of polymer-dispersed liquid crystal films. Liq. Cryst.; 38: 1263–68, 2011. [31] P. Malik, and K. K. Raina, Droplet orientation and optical properties of polymer dispersed liquid crystal composite films, Opt. Mat.; 27: 613–17, 2004.
8
Chapter 1. Liquid Crystals
1. Historical Aspect of LC’s
The origin of liquid crystals can be traced back to 1888 when an Austrian botanist F. Reinitzer was investigating some esters of cholesterol. He observed two melting points: at 145.5°C cholesteryl benzoate melted from a solid to a cloudy liquid and at 178.5°C, it turned into a clear liquid. Some unusual color behavior was also observed upon cooling: first, a pale blue color appeared as the clear liquid turned cloudy and then a bright blue-violet color as the cloudy liquid crystallized. Reinitzer sent the samples of this substance to a German Physicist O. Lehmann who was studying the crystallization properties of various substances. Lehmann observed the sample under his polarizing optical microscope and noted its similarity with some of his own samples. He observed that they flow like liquids and exhibit optical properties like those of a crystal. The subsequent studies established that these observed intermediate phases represent a new thermodynamic state of matter that is quite distinct from the isotropic liquid. The mechanical properties of these phases are intermediate between those of a crystalline solid and an isotropic liquid. Lehmann first referred to them as flowing crystals and, later on, G. Freidel coined the term "liquid crystals" in the twenties of the last century [1].
2. Definition of Liquid Crystals:
Liquid crystals are mesophases between crystalline solids and isotropic liquids. They are usually formed of elongated molecules in which their properties (partial or no positional order, partial orientational order) are intermediate between those of anisotropic liquid (neither positional nor orientational order) and those of a crystal (both positional and orientational order) as illustrated in figure 1-1 [2].
9 Figure 1-2 shows a typical calamitic rod-like liquid crystal molecule. Its chemical name is 4’ -n-heptyl-4-cyano-biphenyl and is abbreviated as 7CB. It consists of a cyanobiphenyl, which is the rigid core and a hydrocarbon chain, which is the flexible tail. If the molecule is completely flexible, it will not have orientational order. If it is completely rigid, it will transform directly from the isotropic liquid phase at high temperature to the crystalline solid phase at low temperature. The rigid part favors both orientational and positional order while the flexible part does not. With balanced rigid and flexible parts, the molecule exhibits liquid crystal phases as clearly indicated in figure 1-3 [3].
Figure 1-2: The chemical composition of 4'-n-heptyl-4-cyano-biphenyl known as 7CB
Figure 1-3: Phase sequence of three organic substances; (a) n-heptane, (b) 4-cyanobiphenyl (c) 7CB (4'-n-heptyl-4-cyano-biphenyl)
Figure 1-3 represents the phase sequence of three organic substances where the first two sequences belong to very dissimilar and non-mesogenic molecules, n-heptane (a) and
4-10 cyanobiphenyl (b). The third sequence is that of the substance c (a-b) obtained by chemically bonding the first two molecules. These species were not randomly chosen; indeed, mesogenic a-b, known as 7CB, is a component of many nematic mixtures used in liquid crystal displays. In n-heptane, because the molecule bears moment dipole of dispersion forces which are weak due to the low polarizability of these molecules which have no double bond, therefore, it is not surprising that at the atmospheric pressure; heptane melts at a temperature as low as -91°C and boils at 98.4°C. On the other hand, 4-cyanobiphenyl melts at a much higher temperature, around 88°C. The height of the melting point is due to the presence of the cyano group −C≡N, which has a strong dipolar moment, and to the high polarizability of the aromatic rings. In conclusion, the 7CB molecule consists of two parts, each of which has a classical phase sequence but with very different melting temperatures.[3]
3. Classification of Liquid Crystals:
G. Friedel named the new states of matter (nematic, smectic, and cholesteric or chiral nematic) as illustrated in figure 1-4. He drew his inspiration from the Greek language:
3.1. Nematic (νημα, thread) because of the linear discontinuities and the winding like threads.
The nematic liquid crystals have long-range orientational order but no long-range positional order. The average orientation of all of the molecules in the nematic liquid crystals is defined as the director n (figure 1-5(a)).
3.2. Smectic (σμεγμα, soap), which means like soaps. Smectic liquid crystals are different
from nematics in that they are formed of layers with an additional degree of positional order. Within the layers, there is a loss of positional order, while the orientational order is still preserved. There are several different categories of smectics. The two well known of these are Smectic A, in which the molecules tend to align perpendicular to the layer planes, and Smectic C, where the alignment of the molecules is at some arbitrary angle to the normal (figure 1-5(b), (c)) respectively.
3.3. Cholesteric (or chiral nematic phase) is typically composed of nematic mesogenic
molecules containing chiral carbon which favors an alignment between molecules at an angle to one another as presented in figure 1-5(d). The term chiral is used to denote an asymmetric molecular structure. It is achieved by attaching the aliphatic moiety to a tetrahedral sp3 carbon atom. Figure 1-4 gives an example of a chiral molecule. This leads to the formation of a structure that can be visualized as a stack of very thin 2-D nematic-like layers with the director in each layer twisted with respect to those above and below. In this structure, the
11 directors actually form a continuous helical pattern around the normal layer. The pitch, Pa, is defined
as the distance it takes for the director to rotate one full turn. [2]
Figure 1-4: an example of cholesteric molecule: 3-methyl 4'-hexyl 4-cyanobiphenyl
Figure I-5: Schematic description of mesogenic phases: (a) nematic, (b) smectic A, (c); smectic C, (d) cholestric.
4. Types of Liquid Crystals:
Two types of liquid crystal mesophases must be distinguished: thermotropic and lyotropic. Thermotropic liquid crystals are of interest in electro-optic displays, sensors, etc. Lyotropic liquid crystals, on the other hand, are of great biological interest and appear to play an important role in living systems. [4]
4.1. Thermotropic Liquid Crystals
The term "thermotropic" arises when transitions of mesophases are mainly affected by changing the temperature. Examples of materials showing thermotropic liquid crystal phases with molecular structures like those presented in Figure 1-6.
12 1. Direct interaction between their permanent electric dipoles. This interaction is attractive for certain positions of the molecules.
2. Permanent dipole-induced dipole interactions. These interactions depend on the molecular polarizability.
3. Induced dipole-induced dipole interactions are among Van Der Waals forces; these interactions also depend on the molecular polarizability. [4]
In alkyl or alkoxy cyanobiphenyls, the polarity of the terminal groups frequently gives rise to very strong intermolecular attractions which result in high melting points of these compounds. The smectogenic molecules are very similar to those exhibiting nematic phases but tend to be slightly longer. This can be achieved by increasing the length of the rigid core of the molecule with the addition of more rings or by making the end groups (the aliphatic chain) longer; When the terminal groups are very short, the material melts from the solid to the nematic phase and finally to the isotropic liquid phase. As the end groups become longer, the sequence of the phase transition changes; the material melts first from the solid to a smectic phase, then to a nematic phase and ultimately to an isotropic phase. With even longer terminal groups the sequence of transition goes from solid to smectic to isotropic liquid. This discussion is recapitulated in table 1-1. [4]
13 Figure 1-6: Polymorphisms of the corresponding series nCB and nOCB
4.2. Lyotropic Liquid Crystals
The most commonly encountered liquid crystals in nature are lyotropic liquid crystals, which are driven to change their phase of the matter by concentration rather than temperature. There are many examples of these materials including surfactants and soaps, the cell membranes in our bodies, the deoxyribonucleic acid (DNA), certain viruses, and many synthetic polypeptides when dissolved in an appropriate solvent (usually water) in suitable concentration form lyotropic mesophases. Therefore, life itself depends on this ubiquitous phase. [3,4]
For example, the phospholipids, which are the main component of the cell membrane, part of the molecule is hydrophobic while the another part is hydrophilic, the lyotropic liquid crystal phase forms from the dissolution of the phospholipids in water as illustrated in Figure 1-7 where (a) is a phospholipid with one saturated chain, 10 to 16 carbon atoms long, (b) a double-chained phospholipid, the R1 chain is saturated while R2 contains a double bond, the
chains contain 12 carbon atoms, (c) sodium dodecyl sulphate(SDS), an anionic detergent, (d) a non-ionic surfactant of the CmEOn series, and C12EO6 is the hexa-ethylene glycol
14 Figure 1-7: Examples of some amphiphilic phospholipid molecules.
5. Eutectic Mixtures of Liquid Crystals
In general, liquid crystal devices in automobile applications tend to be subjected to a wide range of environmental conditions where the operational temperature is in the range of less than −20◦C to more than +100◦C. Some applications are very demanding like the case of aircraft and aerospace display devices.
It is evident that the pure substances of type nCB, nOCB or nCT cannot be directly used alone in liquid crystal displays since the temperature range of the nematic phase ΔTN=TN/I−TCr/N is
either too narrow or at too high temperature. For example, the liquid crystal compound 4’ -n-pentyl-4-cyano-biphenyl (5CB) has a crystal/nematic transition temperature of 24°C and a nematic/isotropic transition temperature of 35°C. This small temperature window is not sufficient for most vehicular and industrial applications and the very high nematic/isotropic transition of 240°C, as in the case of 5CT (4’-n-pentyl 4-cyanotriphenyl), which is too high for such applications. For most cases, no single liquid crystal compound can satisfy all of the necessary requirements for a given practical device. [3]
It is well known that binary mixtures of liquid crystals have a melting point less than those of the two constituent materials; blending the different products in proportions corresponding to a eutectic point in which the melting point of the mixture reaches a minimum as clearly indicated in figure 1-8.
15 Figure 1-8: Theoretical phase diagram for the 5CB/7CB blend computed from the Schroder-van Laar law.[3]
The proportions at the eutectic point of the mixtures 5CB/7CB (figure I-8), can be easily determined by The Schroder-van Laar law:
e i i i T T R H x 1 1 ln (1) Where ΔHi is the latent heat at the crystal/nematic transition for component i,
∆H5CB=4.1kcal/mole and ∆H7CB=6.2kcal/mole, Ti is the crystal/nematic transition temperature of component i, xi is the molar fraction of component i, Te is the temperature at the eutectic point and R is the ideal gas constant.
The eutectic composition is defined by the relation:
1 1
n i i x (2) Combining equations (1) and (2)0 1 1 1 exp
i i e i T T R H (3) Equation (3) can be solved by the Newton-Raphson method to allow a rapid evaluation of theeutectic point of the mixture to be around 3°C. The volume fractions are then 0.6 and 0.4 for 5CB and 7CB respectively. This type of prediction using the Schroder-van Laar law is quite useful but it can fail badly when complex mixtures of structurally different molecules are considered. [5]
16 The relationship between clearing temperature of a nematic mixture and the NI temperatures of its components is closely represented by equation (4):
i i
i
mixture xNI
NI
(4) Where NI is the nematic/isotropic transition temperature in °C and xi represents the molefraction of component i. There have been occasional observations of significance deviations from this relationship, but they are relatively few. Consequently, for the eutectic composition, the nematic/isotropic transition temperature of 5CB/7CB is around 37.8°C. [4]
To further extend the temperature range of the nematic phase, more than two components have to be mixed. For instance, in a blend E7 containing 51% 5CB, 25% 7CB, 16% 8OCB and 8% 5CT, the nematic phase is ranging from - 60°C to TNI=61°C. [6]
6. Properties of Nematic Liquid Crystals: 6.1. Order Parameter:
Nematic liquid crystals are usually uniaxial and are the most widely used liquid crystals in electro-optical applications. The director determines the direction of the preferred orientation of the molecules but it does not represent the degree of the orientational order. The order parameter S, proposed by Tsvetkov [7], provides a measure of the long-range orientational order 2 1 cos 3 2 S (5)
Where θ is the angle between the axis of a molecule and the director of the liquid crystal (Figure I-9); the angular brackets indicate an average over the complete system. For a perfect crystal S = 1 and for the isotropic phase S = 0.
Figure 1-9: Definition of θ used in equation (5).
For nematic liquid crystals, S has a value between 0 and 1, varying with the temperature. The critical temperature at the nematic to isotropic transition point is defined as T0 (Figure I-10).
17 Figure 1-10: Variation of the order parameter S with temperature T.
6.2. Optical Anisotropy or Birefringence:
It is quite evident that the constituent molecules of liquid crystal mesophases are structurally very anisotropic. Because of this shape anisotropy, all the molecular response functions, such as the electronic polarizability, are anisotropic. The long range order in the liquid crystal phases prevents this molecular anisotropy from being completely averaged to zero. Such a liquid crystal exhibits a uniaxial optical symmetry with two principal refractive indices (i.e., birefringence). The ordinary refractive index, no, is experienced by light with polarization perpendicular to the long molecular axis and the extraordinary refractive index, ne, is experienced by light with polarization parallel to the long molecular axis, as illustrated in Figure 1-11 [1]. The birefringence or optical anisotropy is defined as:
o
e n
n
n
(6) If one > no, the liquid crystal is said to have a positive birefringence; whereas, if ne < no, the liquid crystal is said to have a negative birefringence.
For polarized light impinging on a liquid crystal compound at some angle to the long molecular axis, θ, the birefringence is given by:
2 1/2 2 2 2 sin cos o e n n n (7)18 Values of birefringence for calamitic liquid crystals fall in the range of 0.05–0.3 for most commercial liquid crystal mixtures. The birefringence also depends on temperature and goes to zero (Δn → 0) in the isotropic phase. The average refractive index constant in the isotropic phase is given by:
3 2 2
2
2 ne no
n (8) A good experimental example of birefringence is obtained by shining a nonpolarized laser
beam of λ=632.8 nm through a prism (Figure 1-12). The prism is, in fact, a wedge-shaped container filled with the nematic (E7) at 20°C. The container walls are treated by rubbing them to align the nematic molecules parallel to the wedge. [1]
Figure 1-12: a) Experimental evidence for nematic phase birefringence; two rays linearly polarized with a 90° difference exit the prism; b) measuring the angle of least deviation; c) photograph of the experimental setup.
Two refracted rays exit the prism, both linearly polarized, but one is normal to the refraction plane, and the another one is on the plane. If the prism angle is α=20°, the angles of least deviation are δe=13.5° for the first beam and δo=9.1° for the second. With these data, one can
compute the two refraction indices of E7 using the formula (see Figure I-12):
2 sin 2 sin , , eo o e n (9)
19
6.3. Dielectric Anisotropy:
The shape anisotropy of calamitic liquid crystals manifests itself in two often very important properties: (1) dielectric anisotropy and (2) birefringence. Because of the ordering of calamitic molecules, liquid crystals are uniaxially symmetric (i.e., the axis of symmetry is parallel to the axis of the molecules, the director n). As a consequence of this uniaxial symmetry, the dielectric constants differ in magnitude along the long axis (ε॥) and perpendicular to it (ε). This dielectric anisotropy (Δε) is defined as:
Δε = ε॥ − ε (10)
The sign of Δε is of the utmost importance in liquid crystal device applications. The LC molecules can align parallel or perpendicular to applied fields depending on the sign of their dielectric anisotropy, as illustrated in Figure 1-13. Most commonly, compounds exhibit a positive dielectric anisotropy (Δε > 0) that aligns them parallel to applied electric fields, but the inverse is also possible (Δε < 0).
It is also established in the classical dielectric theory that the macroscopic dielectric constant is proportional to the molecular polarizability. In calamitic liquid crystals, the polarizability along the long axis is often greater than that perpendicular to it. For polar calamitic liquid crystals (polar groups are placed between the two aromatic rings), the permanent dipole moment can result in a decrease in Δε; making possible a liquid crystal system with Δε < 0, which is also shown in Figure I-13. The dielectric anisotropy is typically Δε∼ 5–15 for most
liquid crystal materials used in device applications. The LC E7 has Δε=13.8 with ε॥=19.0 at a frequency of 1 kHz [9]
20
6.4. Elasticity:
The elastic properties of liquid crystals are one of their most notable features. Analogous to most liquids and solids, liquid crystals exhibit a so-called curvature elasticity, which is characterized by a set of elastic constants, graphically illustrated in Figure 1-14. These elastic deformations determine the static equilibrium configuration and the restoring torques that arise when the system is perturbed away from its equilibrium configuration. The elastic theory is used to predict stable configurations and electric field-induced elastic deformations of the liquid crystal material, which is a balance between the elastic and electric field torques. [1]
Figure 1-14: Splay, twist, and bend elastic constants. The elastic theory expression is often written in the following form:
2
0 2 33 2 22 2 11 2 1 n E n n K n n K n K f (11) where f is the free energy density, n is the nematic director, E is the applied electric field; K11,K22, and K33 are known as the splay, twist, and bend elastic constants as depicted in Figure
I-14, respectively; and Δε is the dielectric anisotropy. The elastic constants are typical of the order of K∼ 10−11 N for most liquid crystal materials used in device applications. For the LC E7, the elastic constants are K11=K22=K33=13x10-12 N. [9]
7. Phase Diagrams of Liquid Crystal/Polymer Blends
The phase properties of mixtures of polymers and liquid crystals (LCs) have been investigated particularly due to their importance for numerous applications. For example, Polymer Dispersed Liquid Crystals (PDLCs) that are used for light control devices like optical shutters. PDLC films can be electrically switched from a cloudy light scattering off state to an activated transparent on-state. They consist commonly of micron-sized dispersions of low molecular weight LC (LMWLC) within a solid polymer matrix. The electro-optical characteristics of these materials are governed by the thermodynamical properties and therefore, it is important to understand their phase behavior. [12-14]
Many studies on the phase behavior of polymer/liquid crystal blends have been reported in recent years. Kronberg and Patterson [15,16] developed a simple theory for the nematic–
21 isotropic equilibrium in the region of high LC concentration. The theory was tested with EBBA (LC-p-ethoxy benzylidene-p-n-butylaniline) blended with polystyrene and poly(ethylene oxide). Ballauff and Orendi [17,18] used the extended Flory lattice theory to describe the phase behavior of polymer–LC blends, including liquid–liquid phase separation in the isotropic phase. Kelkar and Manohar [19] and Shen and Kyu [20] extended the Flory– Huggins (FH) lattice theory [21,22] of regular solution to describe mixtures of nematic liquid crystals with polymeric solutes. The nematic phase was described in terms of the Maier– Saupe (MS) approximation [23,24]. The combined FH/MS theory predicted a complex phase diagram that consists of isotropic, isotropic–isotropic, isotropic–nematic and pure nematic regions. The theoretical calculation accorded well with the experimental phase diagram of poly(benzyl methacrylate) and PMMA of various molecular weights with nematic mixture E7 and PS with 7CB [25] and E7 [26], respectively.
In the combined FH/MS theory the total free energy g for polymer/nematic liquid crystal blends is described in terms of a simple addition of free energy of mixing of isotropic liquids gi and free energy of nematic ordering of liquid crystals gn:
g =gi + gn (12) For isotropic mixing, as in binary polymer blends, free energy is expressed in terms of the FH theory 2 1 2 2 2 1 1 1ln ln r r nkT G g i i (13) Where k is the Boltzmann constant; T, the absolute temperature; r1, number of sites occupied
in a lattice by liquid crystal molecule which is equal to unity; r2, number of sites occupied by
a polymer chain (each statistical segment is assumed to occupy one lattice site); 1 and 2,
volume fractions of components 1 and 2
1+ 2=1 (14) n is the total number of sites. n = n1r1 + n2r2; where n1 and n2 are the number of liquid crystal
and polymer molecules, respectively, and is the FH interaction (between LC and polymer), a parameter which is generally assumed to be a function of reciprocal temperature
T D C
(15) Where C and D are constants.
The contribution of nematic ordering to the total free energy is generally given by the MS mean field theory
22 2 2 2 1 ) (S S nkT G g n n
(16) Where
(S is the decrease in entropy due to the alignment of individual LC molecule; ) , the nematic interaction parameter (between LC molecules)T TIN 4.54
(17) S, the orientational order parameter
2 1 cos 3 2 S (18)
Where θ is the angle between a reference axis and the director of a liquid crystal molecule and TI–N is the isotropic–nematic transition temperature. Thus, g should be written as follows
2 2 2 1 ) ( ) 1 ( ) 1 ln( 1 ln S S r g
(19)Where is the volume fraction of LC and r is the number of lattice sites occupied by a single polymer chain. Phase diagram of polymer/LC blend including the boundaries for I–I (Isotropic–isotropic phases), I–N (isotropic–nematic phases) and I–I–N (two isotropic– nematic phases) equilibria can be predicted [25].
The study of phase separation in binary systems is important for understanding the formation of the final morphology of polymer/liquid crystal blends. In the case of PDLC the phase separation phenomena control the formation of sample morphology. Crosslinked PDLCs are formed by the two-step process:
1. A low molecular weight LC and a polymer precursor are initially mixed together to form a uniform solution. The phase diagram of the system is characterized usually with an upper critical solution temperature (UCST). The temperature of the mixture should be higher than the mixing temperature Tmix above which the UCST components are co-dissolved. If TTmix,
phase separation leads to the formation of LC regions of various sizes LC. In this case, non-uniform optical properties of PDLC are observed. Calorimetry, light scattering and optical microscopy allow phase diagrams to be formed for the LC/polymer precursor binary system [27–33].
2. The demixing of the liquid crystal from the polymer matrix should occur during the curing reaction. Calorimetry and time-resolved light scattering have been applied to study demixing during cure. The curing process is important in controlling the size and number density of LC microdomains. Calorimetric studies of phase separation process, effects of the concentration and state of cure on mixing and phase separation of the binary system of low-molecular
23 weight liquid crystal and polymer matrix were determined for the first time by Smith [34]. Such experiments were made for a mixture of LC(E7, 5CB) with NOA65 (Norland ultraviolet curable optical adhesive 65 with photoinitiator).
Figure 1-15: Phase diagram for uncured E7/NOA65 mixtures[12]
Figure 1-16: Measured and calculated mixing temperatures for the uncured E7/NOA65 system. Points are Tmix values from Figure 1-15. The solid line is FH binodal curves; dashed line is a corresponding spinodal curve. C, D: parameters of Eq. (3), m1, m2: number of sites occupied by LC and polymer segment (in Eq. (2), respectively, r1 and r2).[12]
24 Figures 1-15 and 1-16 show the phase diagrams for that uncured system, measured and calculated with FH theory according to Nishi [35] prediction for a critical temperature given by:
Where D, C are the constants of Eq. (15).
References
[1] G. P. Crawford, and S. J. Woltman, Liquid crystals: A unique phase of matter, Ch. 1 in, liquid crystals frontiers in biomedical applications, edit. by S. J. Woltman, G. P. Crawford and G. D. Jay, World Scientific, Singapore, 2007.
[2] D. K. Yang, and S. T. Wu, Fundamentals of liquid crystal devices, John Wiley & Sons, West Sussex, England, 2006.
[3] P. Oswald, and P. Pieranski, Nematic, and cholesteric liquid crystals concepts and physical properties, transl. by D. Constantin, Taylor & Francis CRC Press, New York, 2005. [4] E. B. Priestley, Liquid crystal mesophases, Ch. 1 in, Introduction to liquid crystals, edit. By E. B. Priestley, and P. J. Wojtowicz, P. Sheng, Plenum Press, New York, 1974.
[5] V. S. Pasechnik, V. G. Chigrinov, and D. V. Shmeliova, Liquid Crystals Viscous and Elastic Properties Wiley-VCH Verlag, Weinheim, Germany, 2009.
[6] A. W. Levine, Structure- property relationships in thermotropic organic liquid crystals Ch.2 in, Introduction to liquid crystals, edit. By E. B. Priestley, P. J. Wojtowicz, and P. Sheng, Plenum Press, New York, 1974.
[7] V. Tsvetkov, Acta Physicochim. (USSR) 16, 132, 1942.
[8] H. Zhang, Wavelength tunable devices based on holographic polymer dispersed liquid crystals, PhD thesis, Kent State University, USA, 2008.
[9] Merck Product Information. Merck liquid crystals. Licrilite Brochure. Poole: Merck House, 1994.
[10] J. Li, C. H. Wen, S. Gauza, R. Lu, and S. T. Wu, Refractive indices of liquid crystals for display applications. J. Display Technol.; 1: 51–61, 2005.
[11] H. A. Tarry. The refractive indices of cyanobiphenyl liquid crystals. Poole, Great Britain: Merck Ltd., 1967.
[12] J. W. Doane Polymer Dispersed Liquid Crystal Displays. In: Bahadur B (ed) Liquid Crystals: Their Applications and Uses. World Scientific, Singapore, 1990.
[13] P. S. Drzaic, Liquid Crystal Dispersions. World Scientific, Singapore, 1995.
25 [14] M. Mucha, Polymer as an important component of blends and composites with liquid crystals, Prog. Polym. Sci.; 28: 837–873, 2003.
[15] B. Kronberg, and D. J. Patterson, Application of the Flory–Huggins theory to nematic– isotropic phase equilibria, Chem. Soc. Faraday Trans.; 72: 1686–94, 1976.
[16] B. Kronberg, I. Bassignana, and D. J. Patterson, Phase diagrams of liquid crystals/polymer systems. Phys. Chem.; 82: 1714–22, 1978.
[17] M. Ballauff, Phase diagrams of mixtures of liquid crystals polymers: nematic–isotropic phase equilibria versus liquid–liquid demixing. Mol. Cryst. Liq. Cryst. Lett.; 4: 15–22, 1986. [18] H. Orendi, and M. Ballauff, Complete phase diagrams of mixtures of a nematic liquid crystal with n-alkanes. Liq. Cryst.; 6: 497–500, 1989.
[19] V. K. Kelkar, and C. Manohar. Mol. Cryst. Liq. Cryst. Lett.; 133: 267–71, 1986.
[20] C. Shen, and T. J. Kyu, Spinodals in a polymer dispersed liquid crystal, Chem. Phys.; 102: 556–9, 1995.
[21] P. J. Flory, Principles of polymer chemistry, Cornell University Press, Ithaca, NY, 1953. [22] M. L. Huggins, Theory of solutions of high polymers, J. Am. Chem. Soc.; 64: 1712–9,
1942.
[23] W. Maier, and A. Saupe, Eine einfache molecular-statistische theorie der nematischen tristallinflussigen phase, Teil I. Z Naturforsch; 14a: 882, 1959.
[24] W. Maier, and A. Saupe, Eine einfache molecular-statistische theorie der nematischen kristallinflussigen phase, Teil II. Z Naturforsch; 15a: 287, 1960.
[25] C. C. Riccardi, J. Borrajo, and R. J. Williams, Multiple phase equilibria in polydisperse polymer/liquid crystal blends. Macromolecules; 31: 1124–32, 1998.
[26] Z. Lin, H. Zhang, and Y. Yang. Spinodal decomposition kinetics of a mixture of liquid crystals and polymers. Macromol. Chem. Phys.; 200: 943–8, 1999.
[27] G. W. Smith, A calorimetric study of phase separation in liquid crystal/matrix systems: determination of the excess specific heat of mixing. Mol Cryst Liq Cryst; 239: 63–85, 1994. [28] A. M. Lapena, S. C. Glotzer, S. A. Langer, and A. J. Liu, Effect of ordering on spinodal decomposition of liquid crystal/polymer mixtures. Phys. Rev. E; 60: 29–32. 1999.
[29] T. Kyu, C. Shen, and H. W. Chiu. Effect of molecular weight on miscibility phase diagrams in mixtures of polymer and liquid crystals, Mol. Cryst. Liq. Cryst.; 287: 27–34,
1996.
[30] M. Mucha, E. Grosicka, Phase separation in liquid crystal/ polymer composites, Proc. SPIE—Int. Soc. Opt. Engng.; 4147: 382–7, 2000.
26 [31] E Grosicka, Wpływ separacji faz na włas´ciwos´ci układu polimer-ciekły kryształ (influence of phase separation on properties of polymer/liquid crystal system). PhD Thesis. Technical University of Ło´dz´, 2001.
[32] M. Mucha, Z. Kro´likowski, Kinetics study of phase separation in polyacrylic acid/nematic LC system by optical technique. Proc. SPIE—Int. Soc. Opt. Engng.; 4759: 473– 81, 2002.
[33] Z. Kro´likowski. Badania separacji faz w dwuskładnikowych układach wielkocza˛steczkowych (phase separation in two component systems), PhD Thesis. Technical University of Ło´dz´, 2002.
[34] G. W. Smith. Mixing and phase separation in liquid crystal/ matrix systems, Int. J. Mod. Phys. B; 7: 4187–213, 1993.
[35] T. Nishi. Experimental aspects of compatible polymer mixtures. J. Macromol. Sci. Phys; B17: 517–42, 1980.
27
Chapter 2
.Polymer Dispersed Liquid Crystals PDLC’s
As it is stated in the introduction, LC’s were known since the end of the 19th century but their first applications in electro-optic devices appeared in the middle of the 20th century. In such applications, the most attractive properties concern the possibility of controlling the LC optical anisotropy by means of an electric or magnetic field, while the liquid behavior is an undesired characteristic. The term ‘PDLC film’ usually means a solid but flexible film (the polymer matrix) containing a more or less large number of cavities (the ‘droplets’) filled with a Liquid Crystal. Fergason [1, 2] is generally recognized as the first scientist who marked the birth of PDLC’s, even if the term PDLC was introduced a few years earlier by Doane and co-workers [3,4].
Several parameters, influencing the PDLC film behavior, must be taken into account in the choice of the preparation technique:
. Droplet size: Both its average value and its uniformity affect light scattering.
. Droplet shape: The shape of the droplet influences the LC orientation while it is more or less
uniform distribution within the PDLC film may influence light scattering.
. Film thickness: Once the applied voltage has been fixed, the electric field across the PDLC
film is proportional to its thickness, so in large area devices both its average value and its uniformity must be taken into account.
. Film aging: Variations with a time of the chemical and physical properties of the PDLC
films are important to be considered in practical applications.
1. PDLC Preparation Techniques 1.1. Emulsion Technique
The emulsion technique was introduced by Fergason [1,2]. This type of PDLC is obtained by the rapid stirring of a Liquid Crystal in an aqueous solution of a water-soluble polymer which is Poly(vinylalcohol) (PVA) and letting the solvent evaporate. Droplet size is determined by the characteristics of the emulsification processes (i.e. stirring speed and duration). Due to volume change during solvent evaporation, spherical droplets within the emulsion result in elliptical droplets, with major axes being in the plane of the film. The LC used generally has very low solubility with water and in the water-soluble polymer so that it is possible to assume that no phase contamination occurs during PDLC preparation. On the contrary, water-soluble polymers are hygroscopic and this can sensibly reduce the lifetime of the PDLC film.
28
1.2. Phase Separation Technique
The phase separation technique was introduced by Doane and co-workers [3, 4] and marks the start of the use of the term PDLC. In the phase separation technique, the PDLC is obtained starting with a homogeneous, liquid, single-phase mixture containing both the LC and the polymer (or monomer, or prepolymer). During polymer solidification, almost all LC molecules are ‘expelled’ from the polymer and aggregate in droplets which remain embedded in the polymeric film.
The phase separation can be induced in several ways; namely: solvent induced phase
separation (SIPS), temperature-induced phase separation (TIPS), and polymerization-induced phase separation (PIPS)
1.2.1. Solvent-Induced Phase Separation
A solution is prepared by dissolving a thermoplastic polymer, a solvent and a required amount of LC which is only soluble in the solvent, and then the homogeneous mixture is placed over a single transparent conducting electrode. After the solvent has evaporated, thus inducing the phase separation of the liquid crystal into droplets, a second transparent conducting electrode is placed over the PDLC film.
1.2.2. Temperature-Induced Phase Separation
The LC is mixed with a molten thermoplastic polymer at high temperature, then placed between two transparent conducting electrodes and phase separation is induced by polymer solidification, obtained by cooling the sample at a controlled rate.
1.2.3. Polymerization-Induced Phase Separation
The monomer or prepolymer is mixed with the required amount of LC in a single-phase liquid. The liquid is placed between two transparent conducting electrodes and the polymerization process is started, by heating (thermally initiated PIPS, or T-PIPS) when an initiator is added to the mixture or illuminating (photo-initiated PIPS) in the presence of a photoinitiator or exposing the mixture to accelerated electron beams EB without any initiator. Both PIPS and TIPS techniques allow the PDLC film to be prepared directly between the two required transparent electrodes and this has two advantages. The first is that there is a good adhesion of the PDLC film to both electrodes so that the final device is mechanically more robust than emulsion-type PDLC’s. The second advantage is that it is possible to obtain a more uniform and controlled PDLC film thickness just by adding a small amount of ‘spacers’ (often glass spheres or cylinders) to the liquid single-phase mixture. For small PDLC samples, known thickness PET films are used as spacers. [5]
29
1.2.3.1. Photopolymerization
Radiation curing presents a number of advantages, particularly, ambient temperature operation, solvent-free formulations, low energy consumption and the production of polymer materials having tailor-made properties. It has found a large number of applications in various industrial sectors, especially in flexible displays, privacy windows, projection displays, sensors, etc. UV curing is also commonly used to perform the ultrafast drying of protective coatings, varnishes, printing inks and adhesives, and to produce the high-definition images required in the manufacture of microcircuits and printing plates, in addition to its great speed and spatial resolution.
Acrylate-based resins, which polymerize by a radical mechanism, have been thoroughly investigated as they are, by far, the most widely used UV-curable systems, because of their great reactivity. This feature, together with the remarkable chemical, optical and mechanical properties of the polymers obtained, account for the great commercial success of acrylate-based UV-curable resins. It also explains why the photoinitiated polymerization of multifunctional acrylate monomers and prepolymers has been so thoroughly investigated, mainly from the kinetic and mechanistic points of view.[]
Photoinitiated polymerizations occur when radicals are produced by ultraviolet UV light radiation of a homogeneous reaction system containing a monomer or a mixture of monomers or telechelic oligomers or prepolymer, a liquid crystal, and a photoinitiator. During the polymerization, the LC becomes less miscible with the growing polymer and consequently separates into fine droplets containing the confined LC molecules.
The photoinitiator undergoes excitation by energy absorption and subsequent decomposition into radicals as shown in figure II-1.
Figure 2-1: The decomposition of 2-hydroxy-2-methyl-1-phenyl-propane- 1-one (Darocur 1173), X is an OH group.
The benzoyl radical (primary radical) is found to be the major initiating species, while the other radical fragment (secondary radical) may also contribute to the initiation reaction. For diacrylate monomer irradiated in the presence of a photocleavable aromatic ketone, the basic crosslinking polymerization process can be represented in figure 2-2.

![Figure 1-15: Phase diagram for uncured E7/NOA65 mixtures[12]](https://thumb-eu.123doks.com/thumbv2/123doknet/3436302.100389/33.892.234.667.203.498/figure-phase-diagram-for-uncured-e-noa-mixtures.webp)