Verres, Céramiques & Composites, Vol.1, N°2 (2011), 34‐41
34
EFFECT OF P
2O
5ADDITION ON THE MICROSTRUCTURE
AND DIELECTRIC
PROPERTIES OF Pb
0.98Ca
0.02[(Zr
0.52Ti
0.48)
0.98(Cr
3+0.5, Ta
5+0.5)
0.02]O
3L. Hamzioui, A. Boutarfaia, F. Kahoul
Laboratoire de chimie appliquée, Département de chimie industrielle, Université de Biskra B. P. 145, RP-Biskra 07000, Algérie.
E-mail: [email protected]
Abstract
We can note that the sintering temperature of the piezoelectric Pb0.98Ca0.02[(Zr0.52Ti0.48)0.98 (Cr3+0.5,
Ta5+0.5)0.02]O3 can be reduced after the addition of phosphor without compromising the dielectric
properties. A sintered density of 96 % of the theoretical density was obtained for 4 wt. % P2O5 addition
after sintering at 1050 °C for 2 h. Ceramics sintered at 1050 °C with 4 wt. % P2O5 achieve excellent
properties, which are as follows: εr= 18808, tan δ = 0.0094 and Tc = 390°C.
Keywords:Dielectric properties, Electronic materials, Methods physicochemical of analysis, PZT, Piezoelectricity.
Résumé
On peut constater que la température de frittage du piézo-électrique Pb0.98Ca0.02[(Zr0.52 Ti0.48)0.98
(Cr3+0.5, Ta5+0.5)0.02]O3 peut être réduite après l'addition du phosphore sans compromettre les
propriétés mécaniques. La densité frittée de 96 % de la densité théorique a été obtenue pour l’addition de 4 wt.% de P2O5 après le frittage à 1050 oC pendant 2h. Céramiques frittées à 1050 °C avec 4 wt.%
de P2O5 atteindre d'excellentes propriétés, qui sont les suivantes: εr= 18808, tan δ = 0.0094 and
Tc = 390°C.
Mots clés : Propriétés diélectriques, Matériels électroniques, Méthodes physicochimique d’analyse, PZT, Piézoélectricités.
1- INTRODUCTION
Since their discovery (early 50s), ceramic
materials piezoelectric lead zirconate titanate (PZT), have known a very important period of flourishment as evidenced by the growing number of articles and international scientific events devoted to these materials every year [1-4]. These piezoelectric ceramics are currently used as transducers, sensors, ultrasonic motors, actuators…. etc. [5-7]. This is due to their different properties: insulation, dielectric, electromechanical and ferroelectric [8–11]. Within the frame of our work, we are interested in substituting: Pb 2+ with the Ca 2+, couple (Zr 4+ / Ti 4+) with (Cr 3+, Ta 5+) and see
the effect of P2O5 on the dielectric properties of
the solid solution:
Pb0.98Ca0.02[(Zr0.52Ti0.48)0.98(Cr3+0.5, Ta5+0.5)0.02]O3 2- EXPERIMENTAL
The compositions studied are summarized in
Table 1. These compositions have been synthesized by chemical reaction in the solid state. Raw materials were mixed and ground for six hours. After grinding, obtained powder is compacted in the form of pellets at a pressure of 7.50 MPa. Then a preliminary calcination at 800 °C is done for 2 hours with a heating rate of 2 °C / min. The calcined mixture is ground again for 4 hours then molded into pellets under 30 MPa and sintered to 1000, 1050, 1100, 1150 and 1180 °C for 2 h.
The pellets are metalized with the help of a thin layer of dough silver on both of their surfaces. After drying, metallic pellets
undergo minutes. ground, (Diffract 1.54056 tetragon rhomboh electron estimatin size of assesse microgra JMS 64 constant losses w LCR me oven (25 of 2 de frequenc Table 1: 3 3.1- Ana The re at 1050 Accordin P2O5 and phases t Samp 1 2 3 4 5 6 7 ne calcinati . The sintere then analy meter SIE Å) to establ al, rhombo hedral (Mor microscopy ng the size grains after s the pre aphics are m 400. The v t εr, resistiv were examine eter combin 5 degrees C-egrees Cels cy of 1kHz. Different co - RESULTS alysis by X-r esults of X-ra °C are illustr ng to this fi d non-doped tetragonal an ple N° 1 Pb0.9 (Cr3+ 2 Pb0.9 (Cr3+ 3 Pb0.9 (Cr3+ 4 Pb0.9 (Cr3+ 5 Pb0.9 (Cr3+ 6 Pb0.9 0.5, T 7 Pb0.9 0.5, T ions at 750 ed compound yzed by X-EMENS D50 ish crystallog ohedral an rphotropic). y (SEM) is e distribution sintering a esence of made using variation of ity and also t ed by using a ned with a -1200oC) with ius per min mpositions p study. S AND DISCU ray diffractio ays on the sa rated in Fig. 1 gure, sampl d have a coe nd rhombohe Form 98Ca0.02[(Zr0.5 + 0.5, Ta5+0.5)0. 98Ca0.02[{(Zr0 + 0.5, Ta5+0.5)0. 98Ca0.02[{(Zr0 + 0.5, Ta5+0.5)0. 98Ca0.02[{(Zr0. + 0.5,Ta5+0.5)0.02 98Ca0.02[{(Zr0. + 0.5, Ta5+0.5)0.0 98Ca0.02[{(Zr0. a5+0.5)0.02}1-0.1 98Ca0.02[{(Zr0. a5+ 0.5)0.02}1-0.1 0 °C for th ds are caref -ray diffract 00, λ Cu graphic phas nd tetragon The scann a technics n, the avera nd qualitativ porosity. T a Microsco the dielec the angle of a multi-analy programma h a heating r nute and at prepared for USSION on amples sinte 1. les doped w existence of t edral. mula 52Ti0.48)0.98 02]O3 0.52Ti0.48)0.98 02}1-0.02P0.02]O 0.52Ti0.48)0.98 02}1-0.04P0.04]O 52Ti0.48)0.98 2}1-0.05P0.05]O 52Ti0.48)0.98 02}1-0.08P0.08]O 52Ti0.48)0.98(C 1P0.1]O3 52Ti0.48)0.98(C 12P0.12]O3 hirty fully tion Kα: ses: nal-ning for age vely The ope ctric the yzer able rate t a our red with two Fi O3 O3 O3 O3 Cr3+ Cr3+ ig.1: Diffract s togrammes X sintered at 1
X-ray for the 050°C.
35
samples
Verres, Céramiques & Composites, Vol.1, N°2 (2011), 34‐41
36
3.2- morphological Study
Fig. 2shows the SEM image of the fractured surface of Pb0.98Ca0.02[(Zr0.52Ti0.48)0.98(Cr3+0.5,
Ta5+
0.5)0.02]O3 doped by 4 wt.% of P2O5 at
different sintering temperatures (1000 °С, 1050 ºС and 1100 ºС).
At first glance, the three compositions seem homogeneous and there do not appear to have grains of pyrochlore phase that are identifiable by their pyramidal shape [12]. The ruptures with the grain boundaries are synonymous with a good sintering.
Fig. 2: Photographs taken by the scanning
electron microscope for the composition - Pb0.98Ca0.02[(Zr0.52Ti0.48)0.98(Cr3+0.5, Ta5+0.5)0.02]O3 doped by 4 wt.% of P2O5 at different temperatures.
These samples appear very dense, no pores being evidenced on SEM microstructures. It is noted that the average grain size increases with increasing sintering temperature for 2 µm at 1000 ºС up to 2.671 µm at 1050 °С to form a denser and therefore non-porous. Then this size decreases slightly to 1100 °С to reach the value of 2.51 µm. The increase in grain size may have led to the decrease of oxygen vacancies in PZT [13].
3.3- The density
3.3.a- Evolution of the density depending on the sintering temperature
Fig. 3 shows the variation of density with
sintering temperature and the amount of P2O5
addition. It can be seen variation trend with increasing sintering temperature. The density of specimens sintered at 1050 °C showed the maximum value of 7.52 g.cm−3 at 4 wt. % P2O5
and then was decreased after the maximum value. This variation is mainly attributed to the formation of liquid phase of excess PbO that improves densification of the ceramics. However, a large amount of this liquid phase leads to low density which may result from the formation of voids. 1000 1050 1100 1150 1200 5,8 6,0 6,2 6,4 6,6 6,8 7,0 7,2 7,4 7,6 7,8 B u lk d en sity ( g /c m 3) Sintering Temperature (oC) 0.00 P2O5 0.02 P2O5 0.04 P2O5 0.06 P2O5 0.08 P2O5 0.10 P2O5 0.12 P2O5
Fig. 3: Evolution of the density depending on
the sintering temperature.
1000ºС
1050ºС
37
3.4- Study of dielectric properties
For study the dielectric properties, it is
preferably chosen a material not polarized, because it provides a high resistivity, high dielectric constant and low dielectric loss.
3.4.1- The dielectric constant (εr)
3.4.1.a- Evolution of the dielectric constant as a function of temperature
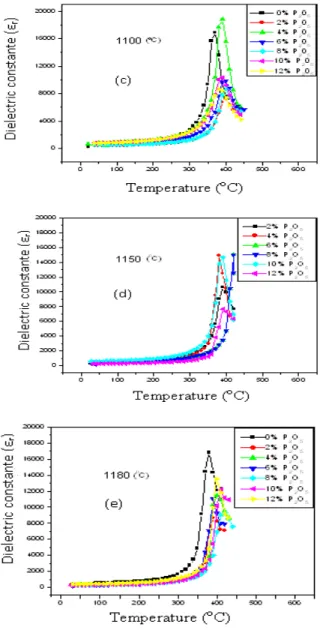
Fig. 4(a, b, c, d and e) shows the variation of the dielectric constant as a function of temperature at sintering temperatures 1000, 1050, 1100, 1150 and 1180 oC. The curves of different samples have virtually the same form; they differ from each other only by the position of their maximum. The introduction of 4 wt. %
P2O5, increases greatly the value of the
dielectric constant until 18808 at the transition temperature of 390 °C and at the frequency of measurement 1kHZ for the sample sintered at 1050 oC. This maximum of dielectric activity can be explained by the presence of several direction of a spontaneous polarization relating to the existence of the two structures: rhombohedral and tetragonal. However, the introduction of (2, 6, 8, 10 and 12 wt. %) P2O5
lowers the value of the dielectric constant for the same frequency of measurement.
Fig. 4: Evolution of the dielectric constant as a function of temperature for all samples:
a) 1000 oC, b) 1050 oC, c) 1100 oC, d) 1150 oC and e) 1180 oC. Below the transition temperature (Tc), the
distortion of the structure perovskite is accompanied by a relative movement of ions. This creates major part of the spontaneous polarization at the level of the lattice. Thus, the ions Ti4+, Zr4+ and Pb2+ respectively do not
occupy the centre and the summits of the lattice; they are shifted in one of the main directions of the crystal lattice. This gives rise to a spontaneous polarization to achieve maximum value for Tc. These changes of the
polarization with Tc explain the value of εr at this
temperature. The transition temperature Tc
corresponds to the maximum peak of the dielectric constant.
Verres, Céramiques & Composites, Vol.1, N°2 (2011), 34‐41
38
3.4.1.b- Evolution of the dielectric permittivity depending on the frequency
The effect of frequency dielectric constant of
the compound doped by 4 wt. % P2O5 is
presented in Fig. 5. From the curve, we find that
εr shows a decrease when the frequency
increases up to 30 KHz and stability from 30 kHz to 100 kHz. According to these results, we
can consider the compound doped by 4 wt. % P2O5 as a soft ceramic and can be used
at high frequencies in the transmission technology. Some authors: Z. He et al. (2004), Y. Xu et al. (1991) explain the maximum value of the dielectric constant at room temperature by the existence of different types of polarization [14–15].
Fig. 5: Evolution of the dielectric constant
depending on the frequency for the sample doped by 4 wt. % of P2O5 at room temperature.
3.4.2- Dissipation factor (dielectric losses tgδ)
This factor that varies depending on
temperature and frequency plays an important role especially in high frequency circuits.
3.4.2.a- Evolution of tgδ as a function of the temperature
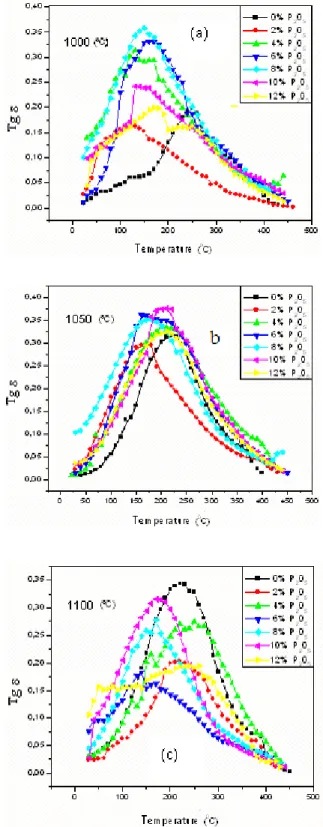
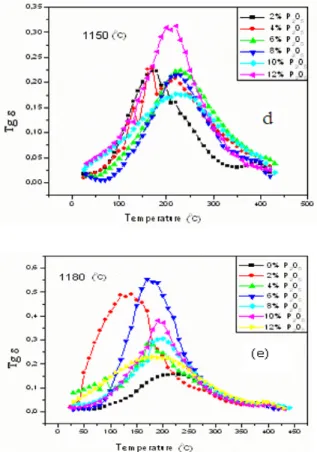
The curves in Fig. 6 (a, b, c, d and e) shows the change in the dissipation factor as a function of temperature for all samples sintered at different temperatures (1000, 1050, 1100,
1150 and 1180 oC). The curves giving
variations tgδ=f(T) retain the same form for different sintering temperatures. The dissipation factor increases with increasing temperature until it reaches a maximum value which reflects a maximum loss dielectric mixture, which is due to movement of the dipole moments and then declines. This decrease caused by the increase in temperature leads to a deterioration in the material properties.
39
Fig. 6: Evolution of factor dissipation as a
function of temperature for all sintered samples: a) 1000 oC, b) 1050 oC, c) 1100 oC,
d) 1150 oC and e) 1180 oC.
3.4.2.b- Study of dissipation factor as a function of P2O5
The effect of composition on the evolution of
dielectric losses is represented in Fig. 7.
Fig. 7: Evolution of dissipation factor as a
function of P2O5.
It is noticeable that there is a variation of the dielectric losses with increasing concentration of P2O5. These losses may reach a minimum
value of 0,942 % to 4 wt. % of P2O5 and a
maximum value of 10,376 % to 8 wt. % of P2O5.
This indicates that the compound doped with 4 wt. % of P2O5 is denser than other compound
doped and non-doped by P2O5. 3.4.3- Resistivity (ρ)
3.4.3.a- Study of resistivity and conductivity as a function of temperature
The study of the variation of resistivity and conductivity as a function of temperature is illustrated in Fig. 8.
Verres, Céramiques & Composites, Vol.1, N°2 (2011), 34‐41
40 Fig. 8: Variation of resistivity and conductivity
as a function of temperature.
The curves of this figure shows that there is a relationship between the relative change in temperature and the two electrical factors (conductivity and resistivity).
The resistivity of each sample decreases with the increases of temperature (Figure 8.a). At 1kHZ we find that resistivity shows a decrease, for the sample doped with 4 wt. % P2O5, the
resistivity decrease for 35 ×10+4 (Ω.cm) at
T = 50 °C until it reaches the value 0.09 × 10 +4 (Ω.cm)at 350 °C (Figure 8.b). This
is due to the fact that high-temperature thermal energy may be sufficient to break some connections or ionic and covalent causes some mobility of ions. However, the electrical conductivity varies in the opposite direction of resistivity; it grows with the increase of temperature (Figure 8.c). It can reach a
maximum value of 7.5×10⁻⁴ (Ω.cm)-1 at a
temperature of 350 °C.
4- CONCLUSION
In the present work we have reported the P2O5-doped Pb0.98Ca0.02[(Zr0.52Ti0.48)0.98(Cr3+0.5,
Ta5+0.5)0.02]O3 ceramic with composition
z = 0.0, 0.02, 0.04, 0.08, 0.10, 0.12 prepared by mixed oxide method. X-ray diffraction studies confirmed coexistence of two phases tetragonal and rhombohedral for the synthesized compound. The effect of temperature sintering on the density and porosity has been studied to achieve the optimum sintering temperature which corresponds to the maximum density and the minimum value of the porosity, because this temperature (1050 °C) corresponds to the product of better quality. The study of dielectric
properties of our solid compound state depending on the temperature allows us to have high values of the dielectric constant, such as density of 7.6 g.cm-3, dielectric constant of
18808, Dissipation factor of 0.0094 and resistivity of 0.09 × 10 +4 (Ω.cm), were found at
4 wt. % P2O5 substituted
Pb0.98Ca0.02[(Zr0.52Ti0.48)0.98(Cr3+0.5, Ta5+0.5)0.02]O3
ceramics sintered at 1050 °C.
REFERENCES
[1] S. Yoon, A. Joshi, K. Uchino, J. Am. Ceram. Soc., Vol. 81, N04, (1998), p 677.
[2] C.A. Randal, N. Kim, J. Kucara,W. Cao, T.R. Shrout, J. Am. Ceram. Soc., Vol. 54,
N05, (1971), p 265.
[3] H.R. Rukimini, R.N.P. Choudhary, V.V. Rao, J. Phys. Chem. Solids, Vol. 59, N07,
(1998), p 1541.
[4] H.R. Rukimini, R.N.P. Choudhary, D.L. Prabhakara, J. Phys. Chem. Solids, Vol. 61 (2000), p 1735.
[5] B. Jaffe, R. Cook, H. Jaffe, Piezoelectric Ceramics, Academic Press,New York,
(1971), p 135.
[6] S.L. Fu, S.Y. Cheng, C.C. Wei, Ferroelectrics, Vol. 67, (1986), p 93.
[7] Shasha Zhao, Hao Wu, Qingchi Sun, Study on PSN–PZN–PZT quaternary
piezoelectric ceramics near the morphotropic phase boundary, Materials Science and
Engineering, B 123, (2005), pp 203–210.
[8] B. Jaffe, S. Roth and S. Marzullo, J. Res. Natl Bur. Standard, Vol. 55, (1955),
pp 239-54.
[9] J. Kelly, M. Leonard, C. Tantigate and A. Safari, J. Am. Ceram. Soc., Vol. 80, N°4,
(1997), p 957.
[10]I.Smith, dans: L.m.Levinson (ED), Céramique Electronique : Propriétés, dispositifs et application, Marcel, Dekker, New York, 1988, p 45.
[11] W. Qiu, H. Hoon Hng, Materials chemistry and phys., Vol. 75, (2002), pp 151-156.
[12] Z. Kighelman, Films minces relaxeur-ferroélectriques à base de Pb
(Mg1/3Nb2/3)O3 : élaboration, propriétés diélectriques et électromécaniques, Thèse de
41 doctorat école polytechnique de Lausanne,
(2001), P 156.
[13] O. Ohtaka, R. Vondermuhl, J. Ravez, Journal of the American Ceramic Society, Vol. 78, No3, (1995), pp 805-808.
[14] Z. He, J. Ma and R. Zhang, Investigation on the microstructure and ferroelectric
properties of porous PZT ceramics, Ceram. Int., Vol. 30, (2004), pp1353-1356.
[15] Y. Xu, Ferroelectric materials and their applications, North-Holland, Amsterdam,
![Fig. 2: Photographs taken by the scanning electron microscope for the composition - Pb 0.98 Ca 0.02 [(Zr 0.52 Ti 0.48 ) 0.98 (Cr 3+ 0.5 , Ta 5+ 0.5 ) 0.02 ]O 3](https://thumb-eu.123doks.com/thumbv2/123doknet/3413659.98857/3.892.107.434.345.1065/fig-photographs-taken-scanning-electron-microscope-composition-pb.webp)