Université de Montréal
Characterization of the Sterile20 kinase Slik: A regulator
of growth in Drosophila
par Apurba Nath
Programmes de Biologie Moléculaire Faculté de Médecine
Mémoire présenté à la Faculté de Médecine en vue de l’obtention du grade de Maitrise
en Biologie Moléculaire option Générale
Février, 2014
ii
Résumé
La prolifération cellulaire et la croissance tissulaire sont étroitement contrôlées au cours du développement. Chez la Drosophila melanogaster, ces processus sont régulés en partie par la kinase stérile-20 Slik (SLK et LOK chez les mammifères) et le suppresseur de tumeur Hippo (Hpo, MST1/2 chez les mammifères) dans les cellules épithéliales. La surexpression de la kinase Slik augmente la taille des tissus chez les mouches adultes. Cependant, les mutants slik-/- meurent avant d'avoir terminé leur développement. Lorsqu’elle est surexprimée dans les cellules épithéliales des ailes en voie de développement, cette protéine favorise la prolifération cellulaire. En outre, l'expression de Slik dans une population de cellules conduit à une surprolifération des cellules voisines, même quand elles sont physiquement séparées. Ceci est probablement dû à la sécrétion de facteurs de croissance qui stimulent la prolifération de manière paracrine. En utilisant des méthodes génétiques et transcriptomiques, nous essayons de déterminer les molécules et les mécanismes impliqués. Contrairement à ce qui a été publié, nous avons constaté que Slik ne transmet pas de signal prolifératif en inhibant le suppresseur de tumeur Merlin (Mer, NF2 chez les mammifères), un composant en amont de la voie Hippo. Plutôt, elle favorise la prolifération non-autonome et la croissance des tissus en signalisation par la kinase dRaf (la seule kinase de la famille Raf chez la drosophile). Nous prouvons que dRaf est nécessaire chez les cellules voisines pour conduire la prolifération chez ces cellules. De plus, nous avons utilisé le séquençage du transcriptome pour identifier de nouveaux effecteurs en aval de Slik. Ce qui permettra de mieux comprendre les effets de SLK et LOK chez les humains.
iii
Abstract
Cell proliferation and tissue growth are tightly controlled during development. In epithelial tissues in Drosophila melanogaster, these processes are regulated in part by the Sterile-20 kinase Slik (SLK and LOK in mammals) and the tumor suppressor Hippo (Hpo, MST1/2 in mammals). Slik overexpression leads to an increase in tissue size in flies, whereas, slik-/- mutants die before completing development. Overexpressing this protein in the developing wing disc epithelium promotes cell proliferation, consistent with the overgrown wing phenotype in the adults. Moreover, expression of Slik in one population of cells leads to an overproliferation of neighboring cells, even when they are physically separated by a central lumen. This can be explained by secretion of paracrine growth factors, stimulating non-autonomous proliferation that is specific to Slik. We used genetic and transcriptomic assays to define the molecules and mechanism involved in Slik-mediated signaling. Contrary to what has been suggested, we found that Slik does not promote proliferation through the tumor suppressor Merlin (Mer, NF2 in mammals), an upstream component of the Hippo pathway, nor through other components of the Hippo pathway. Rather, Slik promotes non-autonomous proliferation and tissue growth signaling through dRaf (the single Raf family kinase orthologue in Drosophila). We found that dRaf is required in the signal receiving cells to stimulate proliferation. We performed RNA-seq to identify novel downstream effectors of Slik. Characterizing the signaling pathway downstream of Slik in Drosophila will shed light on how SLK and LOK function in mammals, and provide insights into their potential involvement during development and in cancer.
iv
Table of contents
Résumé ... ii Abstract ... iii Table of contents ... iv List of figures ... vi List of tables ... vi Abbreviations ... vii Acknowledgements ... viii 1. Introduction ... 11.1 Drosophila as model for studying epithelial tissue growth ... 1
1.1.1 Drosophila life cycle ... 1
1.1.2 Imaginal discs are model systems to study growth ... 2
1.1.3 Studies of imaginal disc growth regulation ... 6
1.2 Sterile20 kinases ... 7
1.2.1 Ste20 kinases as activators of MAPK pathways ... 8
1.2.2 Ste20 kinases as regulators of growth ... 10
1.3 Genetic tools ... 22
1.3.1 GAL4-UAS system... 22
2. Objectives ... 25
3. Results ... 26
3.1 Does Slik signal through the Hippo pathway? ... 26
3.1.1 Inhibition of Merlin does not drive non-autonomous proliferation of PM cells ... 26
3.1.2 Inhibiting Merlin does not enhance Slik overexpression effects ... 30
3.1.3 Slik does not regulate transcription of the Yorkie target gene expanded ... 30
3.2 What is the relationship between Slik and dRaf? ... 36
v
3.3 Discovery of downstream targets of the Ste20 kinase Slik ... 39
3.3.1 Candidate based approach identifies Pvf3 as a potential downstream effector of Slik ... 39
3.3.2 Whole transcriptome sequencing to identify possible downstream targets of Slik .. 43
4. Discussion and Conclusion ... 49
4.1 Slik does not signal through the Hippo tumor suppressor pathway ... 49
4.2 Slik signals through dRaf in the signal receiving PM cells... 51
4.3 Pvf3, a potential downstream target of Slik ... 52
4.4 RNA-seq identifies possible mediators of Slik signaling pathways ... 53
5. Materials and methods ... 56
5.1 Genetics ... 56
5.1.1 Genetic mutants used in this study ... 56
5.1.2 Transgenes ... 56
5.1.3 RNAi transgenics files used in the result section ... 56
5.1.4 Adult wing size measurements ... 56
5.1.5 Antibody staining of wing imaginal discs ... 57
5.1.6 EdU labeling ... 57
5.2 Molecular biology ... 58
5.2.1 QPCR ... 58
5.2.2 RNA-seq ... 59
vi
List of figures
Figure 1.1: Drosophila melanogaster life cycle ... 3
Figure 1.2: The Drosophila wing imaginal disc... 5
Figure 1.3: Ste20 kinases dendogram ... 9
Figure 1.4: Hippo pathway in Drosophila ... 13
Figure 1.5: Slik nonautonomously stimulates proliferation of PM cells ... 21
Figure 3.1: Slik drives non-autonomous proliferation of PM cells ... 28
Figure 3.2: Inhibition of Merlin does not stimulate non-autonomous proliferation of PM cells ... 29
Figure 3.3: Slik driven non-autonomous proliferation of PM cells is Merlin independent ... 31
Figure 3.4: Slik driven tissue growth is Yki independent ... 33
Figure 3.5: Slik does not regulate Yorkie target genes ... 35
Figure 3.6: Slik activates dRaf in the signal receiving cells ... 38
Figure 3.7: pvf3 is upregulated in slik overexpressed discs ... 42
Figure 3.8 Whole transcriptome sequencing to identify potential Slik downstream targets .... 47
List of tables
Table 3.1: List of non-autonomously acting factors in discs ... 41vii
Abbreviations
AEL: After egg laying A/P: Anterior/posterior Ap: Apterious
aPKC: atypical Protein kinase C Crb: Crumbs
DAPI: 4',6-diamidino-2-phenylindole DP: Disc proper
DPP: Decapentaplegic
EdU: 5-ethynyl-2'-deoxyuridine EGF: Epidermal growth factor En: Engrailed
ERK: Extracellular signal-regulated kinase ERM: Ezrin/Radixin/Moesin
Ex: Expanded
FAK: Focal adhesion kinase Ft: Fat
GCK: Germinal center kinase GPCR: G-protein coupled receptor GR: Gustatory receptor
Hpo: Hippo Hth: Homothorax
JNK: c-Jun N-terminal kinase KD: Kinase dead
Lgl: Lethal giant larvae
LOK: Lymphocyte oriented kinase M: Minute
MAPK: Mitogen-activated kinase pathway Mats: Mob as tumor suppressor
Mer: Merlin Mthl: Methuselah NKCC1: Na-K-2Cl
PAK: p21-activated kinase PM: Peripodial membrane
PP2A: Phosphoprotein phosphatase 2A RASSF: Ras association family
RNA-seq: RNA sequencing RTK: Receptor tyrosine kinase Sav: Salvador
Sd: Scalloped
Ser/Thr: Serine/Threonine SLK: Ste20 like kinase
SPAK: Stress activated protein kinase Ste20: Sterile20
Ste20p: Sterile20 protein
STRIPAK: Striatin-interacting phosphatase and kinase
TAO1: Thousand and one amino acid kinase
TNF: Tumor necrosis factor Wts: Warts
Wg: Wingless Yki: Yorkie
viii
Acknowledgements
I would like to take this opportunity to express my appreciation towards Dr. David R. Hipfner for accepting me as a student and giving me the chance to grow as a research scientist. His advice and enthusiasm were valuable for the realization of this project and the thesis. I would like to thank former and current members of the lab for their insightful academic and career advice, and making the lab a pleasant environment. Nathalie Delaunay and Shuofei Cheng have been instrumental in establishing some of the ground works for this project. Special thanks to Shuofei, who mentored me when I started and guided me throughout my master degree. I would also want to thank Dominic Maier for all the suggestions and tips regarding various experiments.
I want to acknowledge Odile Neyret at the core facilities and Neal Cody for their help with establishing the QPCR protocol and helping me with the RNA-seq analysis.
Finally, I would like to thank my family and my friends for all their support and encouragements. Mom, Dad I am grateful for all of the sacrifices you’ve made on my behalf.
1. Introduction
The rates of cell growth, cell division and cell survival during development determine the size of organs and appendages (Conlon and Raff 1999). Tissue growth is a highly dynamic process, where cells compete for growth and survival factors in order to proliferate. Therefore, a net tissue growth means less cell elimination and more proliferation. Though simple, the balance between apoptosis and proliferation needs to be tightly regulated to avoid uncontrolled growth. Moreover, once an organ reaches its “correct” size, mechanisms must be in place to ensure cells stop dividing. How cells know what the “right” size is still a mystery. An even more intriguing phenomenon is regulative development, where stress-induced cell ablation during development stimulates compensatory proliferation to ensure tissues reach their normal adult size (Halder and Johnson 2011). Recently, cell-cell signaling that regulates proliferation as a function of organ size has received much attention with the discovery of Sterile20 (Ste20) kinases and their role in tissue growth. In this thesis, I will highlight important discoveries regarding Ste20 kinases and growth.
1.1 Drosophila as model for studying epithelial tissue growth
Genetics is a powerful tool to study complex biological processes, such as developmental events and behavioural responses. The fruit fly Drosophila melanogaster is used as a model to discover the genetic components of development. The variety and sophistication of the genetic methods and tools developed for Drosophila are unmatched in any other multicellular organism. In addition, the rapid life cycle, low chromosome number, and small genome size make it an excellent model to study developmental processes. In the following sections, I will discuss the life cycle of Drosophila and its use as a model for studying growth.
1.1.1 Drosophila life cycle
Drosophila melanogaster development consists of three stages, embryonic, larval, and pupal, that last about 10 days from fertilization to hatching as an adult fly with a standard diet at 25ᴼC (Figure 1.1) (Ashburner, Golic et al. 2005). After fertilization, eggs are laid and embryogenesis begins. Within 24 hours, a fully formed larva emerges from the egg. The
2
larvae are specialised for feeding, eating about three to five times their own weight over a period of four days during which they grow drastically (Ashburner, Golic et al. 2005). The larval period is divided into three stages, called instars, separated by molts. The first instar lasts for 24 hours, after which the larva molts twice to enter second instar, and again at 72 hours after egg laying to enter the third instar (Ashburner, Golic et al. 2005). The third instar period lasts two days, allowing the larva to complete growth. It then crawls out of the food and undergoes metamorphosis 6 days after egg laying to become a pupa (Ashburner, Golic et al. 2005). This stage lasts about 5 days, leading to the hatching as an adult fly.
1.1.2 Imaginal discs are model systems to study growth
Inside the growing larvae are a series of tissues, called the imaginal discs, that will form much of the adult body. During the pupal stage, when the majority of larval tissues are degraded, the imaginal discs are remodelled to form the adult body. In particular, imaginal discs are sacs of epithelial cells that give rise to the adult appendages, including eyes, legs and wings. The wing imaginal discs are used as model to study mechanisms controlling tissue growth (i.e. increases in size due to increase in number of cells or increased cell size) during development because of the simplicity of working with them. For example, the single-layered epithelium provides wing imaginal discs with structural simplicity, where expression of genes can be modulated and the consequences can be easily visualized by confocal microscopy. Imaginal discs massively increase in size during the larval stages, where they undergo rapid cell proliferation to increase in size up to 1000-fold, going from 50 cells to 50,000 cells (Johnston and Gallant 2002). This proliferation stage is temporally separated from differentiation, which is largely delayed until the pupal stage, thereby simplifying identification of regulators specifically controlling tissue growth (Neto-Silva, Wells et al. 2009). M
Many of the developmental processes are conserved from flies to humans; therefore discoveries made in Drosophila can be extrapolated to humans. For example, epithelial cells composing the imaginal discs are diploid and undergo mitosis like most mammalian cells (Neto-Silva, Wells et al. 2009). The external signals and intrinsic mechanisms regulating disc growth and size during development are conserved in mammals (Wu, Huang et al. 2003). Most cell-cycle and growth regulating genes in Drosophila have homologues in mammals. The simplicity of the system and the conservation of genes and processes regulating growth
3
Figure 1.1: Drosophila melanogaster life cycle
The life cycle of Drosophila melanogaster, after fertilisation, starts with embryogenesis (1), followed by three larval stages (2): 1st instar (L1), 2nd instar (L2), and 3rd instar (L3). Then, the larva undergoes metamorphosis to form a pupa (3), followed five days later by eclosion of the adult fly (4). (Figure modified from Carolina Biological Supply Company)
1
L1
L2
L3
3
4
4
during development, therefore make imaginal discs an ideal system to study growth regulators. In the following section, I will discuss the origin of wing imaginal discs and their structure because it is the model system used in this project.
1.1.2.1 Wing imaginal discs
The wing imaginal disc gives rise to the adult wing and thorax. This developing tissue is first formed in the embryo by invagination of the embryonic ectoderm (Cohen, Simcox et al. 1993). Initially, the wing and leg discs share a common primordium formed by a small cluster of cells. Later, through the combinatorial activity of several genes, including Hox genes, Distal-less and vestigial, these cells separate into distinct imaginal discs (Fuse, Hirose et al. 1996). The wing disc is composed of a cluster of about 50 cells at the end of embryogenesis. During the larval stages, these cells divide rapidly to form the mature wing disc containing about 50 000 cells, forming two discrete layers of epithelial cells called the disc proper (DP) and peripodial membrane (PM) (Figure 1.2). The two monolayers of cells are continuous with their apical membrane facing each other enclosing a lumen. The DP is a highly folded epithelium composed of densely-packed pseudostratified columnar epithelial cells, which will form the wing blade and thorax body wall of the adult fly. The PM is composed of large and flattened squamous epithelial cells.
The process of compartmentalization plays a critical role in proper wing development. A unique feature of the wing disc is the presence of two compartment boundaries: anterior/posterior and dorsal/ventral. Cells committed to either of the compartment do not mix together. The homeobox gene engrailed (en) is present only in the posterior compartment of wing discs, where it controls specific developmental programmes that promote posterior identity of these cells. Consequently, cells that do not express en are committed to the anterior fate. Another selector gene, gene that confers segment identity, is the LIM-homeobox gene apterous (ap), which specifies the identity of dorsal compartment cells. Both selector genes regulate expression of several morphogens and patterning factors, including hedgehog, wingless (wg), and decapentaplegic (dpp) to confer on cells their specific compartmental identities (Neto-Silva, Wells et al. 2009).
5
Figure 1.2: The Drosophila wing imaginal disc
(A) Cross-section view of the Drosophila wing imaginal disc. The peripodial membrane (PM)
and disc proper (DP) form a continuous sac of single layered epithelial cells around a central lumen. DP cells are densely packed pseudostratified columnar cells forming a highly folded epithelium. The red section is called the wing pouch and forms the adult wing after completing development. PM cells (colored in green) are large flattened squamous cells overlying the DP cells. (B) DAPI staining of wing imaginal disc imaged by confocal microscopy. The z-section and the en face view show clear and distinct differences in the organization of the cells between PM and DP. The DP cell epithelial layer is folded with cells closely packed together. Conversely, PM cells are spaced out and flat.
A
6
1.1.3 Studies of imaginal disc growth regulation
Tissue and organ size and shape are tightly controlled during development by mechanisms regulating cell cycle, protein synthesis and apoptosis. These mechanisms coordinate inputs from both extrinsic and intrinsic cues to balance cell proliferation and cell death for a net tissue growth during development (Neto-Silva, Wells et al. 2009). Extrinsic cues are signals arising from the external environment, such as nutrient availability and temperature. Intrinsic cues are inputs from systemic factors, such as hormones and cell-cell interactions. Studies of Drosophila imaginal discs, where the high proliferation rate during the larval stage is fueled by nutrient intake, have shed light on the influence of diet on growth. The highly conserved protein kinase dTOR, the Drosophila targent of rapamicyn, was identified as the main sensor of nutritional status, which by signaling through the insulin-like signaling pathway, controls the rate of protein biosynthesis by directly regulating the translational machinery and ribosomal biosynthesis (Grewal 2009, Hietakangas and Cohen 2009). Another metabolic regulator is Myc, a member of the conserved family of basic-helix-loop-helix (bHLH) transcription factors. Mammals have three Myc proteins; cMyc, N-Myc and L-Myc. The single Drosophila Myc (dMyc) promotes growth by regulating the ribosome biosynthesis (de la Cova and Johnston 2006). Furthermore, dMyc also controls cell cycle progression by acting on Cyclin E, Cyclin D and the retinoblastoma family protein Rb, and apoptosis by inhibiting proapoptotic genes (de la Cova and Johnston 2006). These effects on growth by dMyc are both cell-autonomous and cell-nonautonomous, highlighting the importance of dMyc for growth in Drosophila. Patterning factors, such as Wg and Dpp also regulate growth by controlling cell cycle, proliferation and survival during development (Couso, Bate et al. 1993, Zecca, Basler et al. 1995, Johnston and Edgar 1998, Neto-Silva, Wells et al. 2009, Firth, Bhattacharya et al. 2010). For example, wg mutant wing discs undergo apoptosis by inducing activity of the pro-apoptotic gene hid (Smac/DIABLO and Omi/HtrA2 proteins in mammals), whereas dpp mutant cells leave the epithelium and undergo apoptosis through a JNK-mediated pathway (Giraldez and Cohen 2003, Johnston and Sanders 2003, Gibson and Perrimon 2005, Shen and Dahmann 2005). Both Wg and Dpp are shown to regulate cell cycle. Wg induces cells cycle arrest at both G1 and G2 phase of cells at the dorsal/ventral boundary, giving rise to the cells that form the sensory bristles of the adult wing (Johnston and Edgar 1998). In the eye imaginal discs, Dpp induces cell cycle arrest ahead of
7
the morphogenetic furrow, required for proper cell differentiation (Firth, Bhattacharya et al. 2010).
Recent studies suggest that, though all of these factors modulate the rate of tissue growth, local cell interactions are essential for communicating this information. Cells integrate this information and evaluate their growth and survival status relative to their neighbor, and proliferate accordingly. Thus, cells have a greater control over their immediate environment, enhancing tissue plasticity in the context where cells can mount a rapid stress-induced response by changing their growth status by a mechanism called cell competition. This is a process regulating tissue growth and homeostasis during development, where neighboring cells sense metabolic and growth rate differences, and respond relative to their own fitness status (Bryant and Simpson 1984, Johnston and Gallant 2002, de la Cova, Abril et al. 2004). For example, “stronger” cells will proliferate and “weaker” cells will undergo apoptosis. This phenomenon was first discovered in Drosophila wing imaginal disc mosaics, where cells heterozygous for Minute (M/+) mutations in genes that encode important ribosomal proteins get out-competed and eliminated by wildtype cells (Marygold, Coelho et al. 2005). M/+ cells are at a proliferative disadvantage compared to the other cells. Their elimination stimulates wild type cells to proliferate and fill the vacated space. Local differences in the expression of dMyc also induce cell competition. For example, in genetic mosaic discs, cells mutant for dmyc are eliminated by stimulation of the proapoptotic gene hid (de la Cova, Abril et al. 2004). The influence of cell-cell interaction induced cell competition on normal growth got more attention with the recent discovery of Ste20 kinases regulating tissue size. Below, I will discuss about Ste20 kinases in general, and more specifically about members of this family in Drosophila implicated in regulating tissue growth and organ size.
1.2 Sterile20 kinases
The family of Ste20 kinases share homology to the yeast Saccharomyces cerevisiae Ste20 protein (Ste20p). Ste20 kinases have a conserved Ser/Thr kinase domain and a variable non-catalytic domain, allowing interaction with diverse signaling molecules in different physiological environments (Delpire 2009). In mammals, there are 28 members of the Ste20 kinase family divided into two large groups; the germinal center kinase (GCK) and
p21-8
activates kinase (PAK) families (Figure 1.3) (Sells and Chernoff 1997, Bagrodia and Cerione 1999). This classification is based on the location of the conserved kinase domain – C-terminal for PAKs, and N-C-terminal for GCKs (Delpire 2009). Furthermore, PAKs contain an N-terminal p21-binding domain (or CRIB domain) and are regulated by the small GTPases Rac1 and Cdc42 (Delpire 2009). The GCK group lack the p21 binding domain. Both PAK and GCK families are further subdivided based on the conservation of the kinase domain into PAK-I, PAK-II, and GCK-I to VIII subfamilies (Delpire 2009).
Many Ste20 kinases are functionally regulated by an auto-inhibitory domain that blocks either their kinase domain or CRIB domain (Creasy, Ambrose et al. 1996, Zhao, Manser et al. 1998, Delpire 2009). Auto- or trans-phosphorylation, which stabilizes the kinase in a proper confirmation for substrate binding, is also essential for their activity (Pike, Rellos et al. 2008). The kinase domain has eleven subdivisions, with the subdomain VIII called the signature sequence serving as the substrate recognition site (Sells and Chernoff 1997). The consensus signature sequence of Ste20 kinases (GTPyWMAPEv) is highly conserved across species, suggesting substrate similarities between yeast and mammals. PAKs and GCKs regulate various intracellular events, including the activation of the mitogen activated protein kinases (MAPK) pathway, growth, cell survival, apoptosis and migration (Sells and Chernoff 1997, Bagrodia and Cerione 1999, Kyriakis 1999, Delpire 2009, Wagner and Sabourin 2009). In the following sections, I will discuss the MAPK pathway and the three Drosophila Ste20 kinases that are shown to regulate growth – Hippo, Tao1 (TAO in mammals), and Slik.
1.2.1 Ste20 kinases as activators of MAPK pathways
The yeast Ste20p is a putative mitogen-activated protein kinase kinase kinase kinase (MAP4K) discovered in yeast by using genetic approaches for identifying genes that are targets of the Gβγ-protein subunits (Wu, Whiteway et al. 1995). The PAK-like Ste20 kinase
phosphorylates the yeast MAP3K Ste11, thereby transmitting the pheromone signal from the G-protein βγ subunits to downstream MAP kinases Fus3 and Kss1 (Wu, Whiteway et al. 1995, Drogen, O'Rourke et al. 2000). Because of the homology to Ste20p, mammalian Ste20 kinases were suggested to be potential MAP4Ks. Indeed, many have since been shown to activate
9
Figure 1.3: Ste20 kinases dendogram
Represented here are 27 mammalian Ste20 kinases. Ste20 kinases are divided into two families – germinal center kinase (GCK) and p21-activated kinase (PAK). These are further divided into subfamilies – PAK-I, PAK-II, and GCK-I-VIII. PAK 4-6 form the family of PAK-II. (Adapted from Delpire 2009)
10
MAPK pathways either by direct phosphorylation or protein-protein interactions. For example, MAPK1, which is principally expressed in hematopoietic organs, binds and phosphorylates MEKK1 directly to activate the JNK/SPAK signaling pathway (Hu, Qiu et al. 1996, Delpire 2009). MAPK2 is also shown to activate MEKK1, however this function is independent of the catalytic domain (Chadee, Yuasa et al. 2002).
MAPK pathways regulate cellular responses to various extracellular and environmental stimuli, including growth factors, cytokines, neurotransmitters, hormones, cellular stress, and cell adherence, by modulating gene expression through activation of transcription factors (Delpire 2009). MAPK/ERKs (extracellular signal-regulated kinase) are a large group of serine/threonine kinases subdivided into five families: MAPKerk1/2, MAPKp38, MAPKjnk, MAPKerk3/4, and MAPKerk5. The kinase module of the pathway is composed of three kinases, including MAPK kinase kinase (MAP3K), MAPK kinase (MAP2K), and MAPK (Boulton, Yancopoulos et al. 1990, Boulton, Nye et al. 1991, Mendoza, Er et al. 2011). MAP3Ks are Ser/Thr kinases that are activated either by MAP4Ks phosphorylation, by interaction with small GTP-binding proteins of the Ras or Rho family, or by oligomerization and subcellular localization (Fanger, Gerwins et al. 1997, Mendoza, Er et al. 2011). Activation of MAP3Ks stimulates their Ser/Thr kinase activity leading to the phosphorylation and activation of MAP2K (Siow, Kalmar et al. 1997, Mendoza, Er et al. 2011). MAP2K are termed dual-specificity kinases because they phosphorylate MAPK at a Thr-X-Tyr motif in the activation loop (Gartner, Nasmyth et al. 1992). Once activated, MAPKs then phosphorylate numerous substrates, including transcription factors, other protein kinases, phospholipase, and cytoskeleton-associated proteins, leading to diverse cellular responses.
1.2.2 Ste20 kinases as regulators of growth
One of the conserved functions of the Ste20 family kinases is regulation of the tissue growth. Genetic screens in Drosophila led to the identification of three Ste20 kinases playing an important role in regulating growth. Although the mechanisms by which these kinases are regulated are diverse, the common involvement of cell polarity complexes and apical localization suggest an essential role for cell-cell interactions. Recent characterization of these kinases functions and roles will be discussed below.
11
1.2.2.1 Ste20 kinase Hippo, a regulator of growth in Drosophila
The Ste20 Mst1 and 2 kinases are members of the GCK-II family and are homologous to Drosophila Hpo. Mst1/2 are redundant in regulating growth via the Mst/Lats/YAP pathway, more commonly known as the Hippo pathway in Drosophila (Avruch, Zhou et al. 2011). The pathway is conserved between flies and mammals, and all the components of the pathway share high homology. This network integrates cell-cell contact and cell polarity cues to restrict growth (Reddy and Irvine 2008). Mst1/2 were shown to restrict organ size and suppress tumor/growth by inducing apoptosis both in transformed cells and mice livers (Zhou, Conrad et al. 2009, Lu, Li et al. 2010, Song, Mak et al. 2010).
The Ste20 kinase Hpo is a tumor suppressor regulating growth and tissue size during development (Badouel, Garg et al. 2009). The Hippo pathway is extensively studied in Drosophila. Along with Salvador (Sav; Sav1/WW45 in mammals), Warts (Wts; Lats1/2 in mammals), and Mob as tumor suppressor (Mats; Mob1A, Mob1B in mammals), Hpo forms the core of the evolutionarily conserved Hippo pathway (Figure 1.4). This pathway was discovered through genetic screens in Drosophila, where it was found to restrict organ growth and tissue size and to promote apoptosis during development by suppressing the activity of the transcription cofactor Yorkie (Yki, YAP/TAZ in mammals) (Kango-Singh, Nolo et al. 2002, Tapon, Harvey et al. 2002, Harvey, Pfleger et al. 2003, Jia, Zhang et al. 2003, Pantalacci, Tapon et al. 2003, Udan, Kango-Singh et al. 2003, Wu, Huang et al. 2003, Reddy and Irvine 2008). Mutations disrupting Hpo, Sav, Mats, or Wts function induce Yki transcriptional activity, leading to overgrowth of Drosophila imaginal discs. The mechanism regulating Yki activity is the phosphorylation cascade between the Ser/Thr kinases Hpo and Wts, where active Hpo phosphorylates the WW-domain adaptor protein Sav (Wu, Huang et al. 2003, Wei, Shimizu et al. 2007). Sav then acts as a scaffold protein bringing Wts near Hpo, facilitating Wts and Mats phosphorylation by Hpo (Wei, Shimizu et al. 2007). The Wts/Mats complex in turn phosphorylates Yki, creating a binding site for the 14-3-3 phosphopeptide binding protein, leading to retention of Yki in the cytoplasm and inhibition of its transcriptional activity, which are pro-proliferative and anti-apoptotic (Huang, Wu et al. 2005, Dong, Feldmann et al. 2007, Oh and Irvine 2008, Oh and Irvine 2009, Ren, Wang et al. 2010).
12
Yorkie forms complexes with various DNA binding transcription factors
Drosophila Yki lacks a DNA binding domain, similar to both mammalian homologues YAP and TAZ. Therefore, Yki forms a complex with other DNA-binding transcription factors, such as Scalloped (Sd), Mothers against DPP (Mad), and a Homothrax-Teashirt (Hth-Tea) complex, to promote tissue growth by stimulating transcription of the Drosophila inhibitor of apoptosis 1 (diap1), the growth promoter Myc, and cell-survival promoter miRNA bantam (ban) (Kango-Singh, Nolo et al. 2002, Harvey, Pfleger et al. 2003, Jia, Zhang et al. 2003, Pantalacci, Tapon et al. 2003, Huang, Wu et al. 2005, Nolo, Morrison et al. 2006, Thompson and Cohen 2006, Goulev, Fauny et al. 2008, Lei, Zhang et al. 2008, Peng, Slattery et al. 2009, Neto-Silva, de Beco et al. 2010, Ziosi, Baena-Lopez et al. 2010). Interestingly, Yki association with these DNA-binding transcription factors is tissue specific. For example, though yki is essential for growth of all the imaginal discs, sd is only required in the wing and hth for the eye discs (Campbell, Inamdar et al. 1992, Liu, Grammont et al. 2000, Peng, Zeng et al. 2009). Interestingly, multiple Yki binding partners serve to increase the range of its target genes. For instance, Sd mediates transcription of diap1, whereas ban is a target of Mad and Yki-Hth transcription factors (Peng, Zeng et al. 2009, Oh and Irvine 2011).
Negative regulation of the Ste20 kinase Hpo
Exactly how Hpo is regulated during development is still unclear. Hpo homodimerization and apical membrane localization appear to be important. Homodimerization is thought to be essential to induce transphosphorylation and localization to the membrane, thereby increasing Hpo activity (Glantschnig, Rodan et al. 2002, Lee and Yonehara 2002, Deng, Matsui et al. 2013). Recently, two mechanisms have been identified that negatively impact Hpo activity – dephosphorylation by the phosphoprotein phosphatase 2A (PP2A) and competition for the scaffold protein Sav by Ras association family member (dRASSF; RASSF in mammals) (Polesello, Huelsmann et al. 2006, Ribeiro, Josue et al. 2010). Using genomics and proteomics, the Drosophila PP2A portion of the dSTRIPAK (Drosophila Striatin-interacting phosphatase and kinase) complex was found to associate with and dephosphorylate Hpo (Ribeiro et al., 2010).
13
Figure 1.4: Hippo pathway in Drosophila
The Hippo tumor suppressor pathway restricts growth and induces apoptosis by negatively regulating the transcription co-activator Yorkie (Yki). The pathway is essentially a phosphorylation cascade mediated by the two Ser/Thr kinases, Hpo and Wts. Active Hpo phosphorylates Sav, which acts as scaffold protein to bring Wts closer to Hpo. Hpo is able then to phosphorylate Wts and Mats, thereby activating Wts kinase activity. Wts in turn phosphorylates Yki, leading to its cytoplasmic retention and inhibition of its transcriptional activity. (Adapted from Staley and Irvine 2012)
14
The dSTRIPAK complex also forms a complex with dRASSF, facilitating the recruitment of dSTRIPAK to Hpo (Ribeiro, Josue et al. 2010). Both Sav and Hpo have SARAH domains that are required for binding to each others. This interaction is essential for activation of Hpo. On the other hand, the SARAH domain of the Drosophila dRASSF binds to Hpo and forms a complex, thereby competing for binding with Sav and restricting Hpo activity (Polesello, Huelsmann et al. 2006).
Modulation of the Hippo pathway is mainly achieved by a number of upstream regulators, including the Mer-Expanded complex, the transmembrane Cadherin Fat and the actin cytoskeleton. These upstream regulators control the apical membrane localization of the components of the pathway, as discussed below.
Expanded, Merlin, and Kibra complex regulate localization of Hpo
The two cytoplasmic FERM domain proteins Expanded (Ex) and Merlin (Mer), and the WW domain protein Kibra (Kbr) form a complex at the apical membrane of cells and positively regulate Hpo homodimerization (Hamaratoglu, Willecke et al. 2006, Baumgartner, Poernbacher et al. 2010, Genevet, Wehr et al. 2010, Deng, Matsui et al. 2013). A number of transmembrane or membrane-associated proteins act on these proteins to control Hpo pathway activity. For example, Crumbs (Crb), a transmembrane protein involved in epithelial cell polarity containing an intracellular FERM domain, binds to Ex, promoting its localization to the apical membrane. Mis-regulation of Crb leads to its mis-localization, and in turn to the mis-localization of Ex, inducing Yki activity (Chen, Gajewski et al. 2010, Grzeschik, Parsons et al. 2010, Robinson, Huang et al. 2010). In addition to Crb, Lethal giant larvae (Lgl), another cell polarity protein, has tumor suppressor properties, the mechanism of which was unknown until it was linked to the Hippo pathway. The neoplastic tumor suppressor Lgl regulates localization of Hpo and dRASSF, to the apical membrane by antagonistically acting on another polarity complex, the atypical Protein kinase C (aPKC) complex (Grzeschik, Parsons et al. 2010, Menendez, Perez-Garijo et al. 2010).
Regulation of the Hpo pathway by actin cytoskeleton
Cytoskeleton dynamics can also regulate the Hpo pathway, suggesting a tight interplay between cell shape and normal tissue size. The actin capping proteins, Cpα and Cpβ, which
15
function to regulate actin polymerization, suppress growth by the activity of Yki in flies (Fernandez, Gaspar et al. 2011, Sansores-Garcia, Bossuyt et al. 2011). Similarly, accumulation of F-actin by mutation/downregulation of these actin capping proteins or by decreasing the actin regulatory protein Capulet at the apical membrane stimulates Yki activity in Jnk-dependent and -inJnk-dependent manners (Fernandez et al., 2011; Sansores-Garcia et al., 2011). The Drosophila FERM protein Ex also inhibits actin polymerization, thereby reducing F-actin accumulation (McClatchey and Giovannini 2005, Fernandez, Gaspar et al. 2011). Hpo pathway activation in ex mutants may thus be related to an increase in F-actin accumulation.
The transmembrane protein Fat regulates localization of Warts, Expanded, and Yorkie
The large transmembrane Cadherin-related protein Fat (Ft), involved in the planar cell polarity pathway, promotes the abundance and apical localization of Wts, Ex, and Yki, thereby positively regulating the Hpo pathway (Bennett and Harvey 2006, Cho, Feng et al. 2006). Dachs, an unconventional myosin acting downstream of Ft, shows differential localization influenced by Ft, where it is apical in Ft mutant cells, and cytoplasmic in Ft overexpressing cells (Mao, Rauskolb et al. 2006). Dachs associates with the Drosophila LIM domain protein Zyx, one of several LIM domain proteins implicated in Hpo signaling. Dachs binding stimulates the conformational change of Zyx (Oh and Irvine 2011, Rauskolb, Pan et al. 2011). The LIM domain of Zyx is then available to bind to Wts, leading to the degradation of Wts, thereby providing another means of linking the Ft pathway to the Hpo pathway (Rauskolb, Pan et al. 2011).
Another LIM domain protein that associates with Wts in Drosophila is the single Ajuba family protein Jub. It regulates tissue growth and organ size by directly associating with both Wts and Sav, thereby inhibiting the kinase activity of Wts and increasing Yki transcriptional activity (Das Thakur, Feng et al. 2010). Moreover, in Drosophila, Jub was shown to link the epidermal growth factor receptor (EGFR) and the Ras-Raf-MAPK pathway to increased Yki activity (Reddy and Irvine 2013). Signaling through EGFR increases the phosphorylation of Jub, and as mentioned above Jub then directly interacts with Wts and Sav and suppresses Wts kinase activity (Reddy & Irvine, 2013). Consequently, active unphosphorylated Yki translocates into the nucleus and transcribes growth promoters and anti-apoptotic genes in EGF-responding cells.
16
1.2.2.2 Ste20 kinase Tao1, restricts growth via the Hippo pathway
Thousand and one amino acid kinase 1 (TAO1) was first discovered in mammals through amplification by degenerate primers of sequences from rat, that were related to the yeast Ste20p (Hutchison, Berman et al. 1998). Subsequently, two more member of the GCK-VIII subfamily have been cloned – TAO2 and TAO3 (Chen, Hutchison et al. 1999, Tassi, Biesova et al. 1999). These Ser/Thr kinases regulate cell cycle progression, apoptosis, and microtubule dynamics (Hutchison, Berman et al. 1998, Chen, Raman et al. 2003, Mitsopoulos, Zihni et al. 2003, Raman, Earnest et al. 2007, Wu and Wang 2008). Interestingly, both TAO1 and TAO2 have catalytic and non-catalytic activities. For example, cell cycle arrest upon DNA damage mediated by TAO1 and TAO2 requires their kinase activity to induce the p38 MAPK response (Raman, Earnest et al. 2007). However, overexpression of TAO1 has been shown to induce apoptosis in human neuroblastoma cells in a catalytic activity-independent manner (Wu and Wang 2008). The regulatory domain of TAO2 stabilizes microtubules through direct binding, another catalytic-independent function (Mitsopoulos, Zihni et al. 2003, Delpire 2009). The upstream signals regulating TAOs are largely unknown. TAO1 is shown to be phosphorylated in vitro by ATM (ataxia telangiectasia mutated), leading to p38 MAPK activation by phosphorylation of MEK3 and MEK6 (Raman, Earnest et al. 2007). TAO3, which in response to stress inhibits the JNK/SAPK (c-jun N-terminal kinase/stress activated protein kinase) MAPK pathway, is negatively modulated by EGF, potentially linking this kinase to growth/survival signaling (Tassi, Biesova et al. 1999, Delpire 2009).
The single Drosophila Tao1 was identified by RNAi screening in cultured Drosophila cells as a microtubule dynamics regulator (Liu, Rohn et al. 2010). Thereafter, it has been implicated in regulating cell shape, apoptosis and tissue growth (Sato, Hayashi et al. 2007, Liu, Rohn et al. 2010, Boggiano, Vanderzalm et al. 2011).
Depletion of tao-1 in cultured cells increases microtubule protrusions, suggesting that Tao-1 regulates microtubule dynamic (Sato, Hayashi et al. 2007). Later, Tao-1 was shown to bind microtubules and destabilize plus-end growth, thereby regulating cell form (Liu, Rohn et al. 2010). Tao-1 also regulates apoptosis in germ line cells by inducing the expression of the gene sickle (skl), thereby potentiating the activity of the protein Hid leading to increase in apoptosis (Sato, Hayashi et al. 2007). Because of its implication in apoptosis and microtubule
17
stability, Tao-1 became a potential candidate for regulating growth in flies. Tao-1 was later identified as a growth regulator by in vivo RNAi screening in Drosophila, where its depletion induced overgrowth of the eye (Boggiano, Vanderzalm et al. 2011, Poon, Lin et al. 2011). This led to discovery of Tao-1 as Hpo kinase, where it phosphorylates Hpo at threonine-195 in the activation loop, leading to an increase activity of the tumor suppressor Hippo pathway, thereby restricting tissue growth (Boggiano, Vanderzalm et al. 2011, Poon, Lin et al. 2011).
1.2.2.3 Sterile20 kinase Slik, promote growth during development in Drosophila
The Ste20 kinase SLK was discovered in a two hybrid screen for myogenic regulators in mice (Sabourin and Rudnicki 1999). It is a member of the GCK-V subfamily. The other member of that family is the lymphocyte oriented kinase (LOK). SLK and LOK are homologous to the Drosophila Ste20 kinase Slik (Hipfner and Cohen 2003). SLK is ubiquitously expressed. During development, it is predominantly enriched in neuronal and muscle tissue (Zhang, Hume et al. 2002, Wagner and Sabourin 2009). On the other hand, LOK is enriched in the lymphoid organs (Kuramochi, Moriguchi et al. 1997). In cultured cells, SLK and LOK have been linked to regulation of various cellular functions. For example, SLK was shown to mediate apoptosis through diverse pathways, including phosphorylating and activating p53, JNK1, and signal-regulating kinase-1 (ASK1) (Sabourin and Rudnicki 1999, Sabourin, Tamai et al. 2000, Hao, Takano et al. 2006, Cybulsky, Takano et al. 2009, Cybulsky, Takano et al. 2010). SLK has also been shown to bind to microtubules and co-localize with cell adhesion signaling molecule, including paxillin and Rac1 at the leading edge of migrating cells, regulating cell adhesion and spreading (Wagner, Storbeck et al. 2008, Quizi, Baron et al. 2013). This is achieved through the phosphorylation of paxillin, the focal adhesion adapter protein, stimulating cell migration through focal adhesion kinase (FAK)/MAPK signaling pathway (Quizi, Baron et al. 2013). Similarly, another study showed that SLK signaling through FAK and Src is necessary for cell migration upon stimulation of the tyrosine kinase receptor HER2/ErbB2/Neu, which is highly upregulated in breast cancer, suggesting a link between cancer cell migration and SLK (Roovers, Wagner et al. 2009). LOK was shown to have an analogous role in lymphocyte, where it regulates lymphocyte adhesion by controlling the distribution of active leukocyte-function-associated antigen 1 (LFA1) by an unknown mechanism (Endo, Toyama-Sorimachi et al. 2000). SLK has been linked to
18
preserving radial microtubule array through its phosphorylation activity on the p150(Glued) subunit of dynactin, consistent with the fact that SLK associates to microtubules (Zhapparova, Fokin et al. 2013). Considering that SLK is located at the apical compartment of the epithelial cells and that the kinase is implicated in microtubule stabilization, it is logical that SLK would restrict microvilli to the apical side. This is done by regulating the apical localization of the ERM protein Ezrin through phosphorylation (Viswanatha, Ohouo et al. 2012). LOK has also been identified in lymphocytes as an ERM kinase and similarly regulating cytoskeleton rearrangement (Belkina, Liu et al. 2009). SLK cytoskeletal modeling also controls vasodilatation by phosphorylation of RhoA (Guilluy, Rolli-Derkinderen et al. 2008). Another function of SLK that has been identified is its requirement for cycle progression through G2
(O'Reilly, Wagner et al. 2005). Moreover, SLK also regulates normal muscle and kidney development in mice (Cybulsky, Takano et al. 2004, Storbeck, Daniel et al. 2004, Luhovy, Jaberi et al. 2012, Storbeck, Al-Zahrani et al. 2013).
SLK regulation is achieved mainly through phosphorylation and homodimerization. SLK is phosphorylated at T183 and S189 in the activation segment of its catalytic domain, leading to the kinase domain homodimerization (Delarosa, Guillemette et al. 2011, Luhovy, Jaberi et al. 2012). SLK localization to the microtubule at the leading edge of migrating cells is mediated by c-Src (Wagner and Sabourin 2009) Moreover, LIM domain-binding transcriptional cofactor proteins Ldb1 and Ldb2 directly interact with SLK at the C-terminal AT1-46 homology domain to maintain SLK in an inactive state (Storbeck, Wagner et al. 2009).
Overall, the diverse functions of SLK and LOK that have been reported were mainly identified in cultured cells. The involvement of these kinases in regulation of apoptosis, cell cycle progression and actin cytoskeleton dynamics suggests they may play a greater role in normal and/or pathological tissue growth. Although no clear picture of the physiological functions of SLK and LOK has emerged, recent studies of Drosophila Slik have clearly implicated this kinase in regulating tissue growth and morphogenesis during development.
Slik was discovered in Drosophila in a systemic genetic overexpression screen. Overexpression of Slik in posterior cells in the wing discs led to the overgrowth of the
19
posterior compartment of the wings (Hipfner and Cohen 2003). Two separate functions of Slik have been characterized in flies – it regulates growth and epithelial integrity during development. Interestingly, the effect of Slik on tissue growth is catalytic-activity independent, whereas its function on actin-cytoskeleton dynamics requires its kinase activity. During development, it was found that Slik regulates the rate of cell proliferation and affects cell survival by an unknown mechanism (Hipfner and Cohen 2003). It has been shown that cells mutant for slik, are eliminated through apoptosis by activation of the JNK pathway (Hipfner and Cohen 2003). The overgrowth of the adult wings by overexpressing Slik is due to an increase in the rate of cell proliferation in wing imaginal discs (Hipfner and Cohen 2003). Interestingly, this over-proliferation is also detected in cells in the overlying peripodial membrane of the wing discs, where the transgene is not expressed, suggesting a non-autonomous role of Slik (Figure 1.5) (Hipfner and Cohen 2003). This proliferation was suppressed in a draf heterozygous background, suggesting that dRaf acts downstream of Slik in the non-autonomous signaling pathway (Hipfner and Cohen 2003). Another potential link between Slik and growth is through Mer (Hughes and Fehon 2006). Slik was shown to regulate Mer phosphorylation, leading to its mis-localisation away from the plasma membrane, thereby presumably inhibiting growth suppression by the tumor suppressor Hippo pathway (Hughes and Fehon 2006).
Genetic analysis indicated that Slik has a separate catalytic-activity dependent function. Slik mutant cells are extruded out of the epithelium sheet and most undergo apoptosis, suggesting that Slik’s requirement for maintenance of epithelial integrity may explain the increased apoptosis observed in slik mutant cells (Hipfner, Keller et al. 2004). During development, Slik regulates cellular architecture by phosphorylating and activating the single ERM family protein Moesin in Drosophila (Hipfner, Keller et al. 2004, Carreno, Kouranti et al. 2008). Moesin activation and cortical localization stabilizes F-actin and reduces Rho1 activity, thereby maintaining epithelial integrity (Speck, Hughes et al. 2003). Slik-mediated phosphorylation of Moesin also serves an important function during meiosis, where cells undergo changes in their form. For example, the spatiotemporal regulation of Moesin by Slik during cell division is required for cortical rigidity and cell rounding, important for
20
spindle orientation and chromosome alignment. (Carreno, Kouranti et al. 2008, Kunda, Pelling et al. 2008).
Little is known about how Slik is regulated. Nonetheless, it was shown that its localization and abundance at the apical region of cells are important for Moesin activation. Regulating these is Sip1, the Drosophila orthologue of the ERM binding protein 50 and the Na+/H+ exchange regulator NHERF1 (EBP50/NHERF1), which binds both Slik and Moesin, thereby facilitating Moesin phosphorylation (Hughes, Formstecher et al. 2010). Another protein that regulates the function of Slik in the maintenance of the epithelium is Flapwing, the Drosophila phosphatase type 1β. It forms a complex with both Mer and Moesin, and co-regulates their dephosphorylation, consequently affecting their localisation and plasma membrane trafficking, and ultimately negatively impacts epithelial integrity (Yang, Primrose et al. 2012).
21
Figure 1.5: Slik nonautonomously stimulates proliferation of PM cells
Confocal images of peripodial membrane (PM) layer of wing imaginal disc stained with DAPI (in blue), labeling nuclei, and BrdU (in red), labeling cells undergoing proliferation. (A,D) Wing disc expressing GFP alone in the underlying DP cells, showing flattened, widely spread out DAPI staining and little BrdU labeling. (B,C,E,F) Expression of both Slik (B,E) and kinase dead Slik (SlikKD) (C,F) in DP cells drives proliferation of the PM cells, as indicated by the increase in DAPI and BrdU labeling when compared to the wing disc expressing GFP alone. The arrows indicate the high nuclear density (B,C) and high BrdU uptake (E,F). (Modified from Hipfner and Cohen 2003)
ptc>GFP ptc>slik ptc>slikKD
A
B
C
22
1.3 Genetic tools
Drosophila offers numerous advantages for genetic studies. For example, it is a genetically simple organism with only four pairs of chromosomes. Fruit flies have numerous external appendages that can be subjected to non-lethal mutation that can serve as markers to follow mutants through generations (Beckingham, Armstrong et al. 2005). In addition to these natural advantages, the creation of balancer chromosomes made Drosophila the standout model for genetic studies. Balancer chromosomes have multiple re-arrangements inhibiting homologous recombination. Therefore, they allow mutation of interest to be stably maintained and tracked through many generations (Beckingham, Armstrong et al. 2005). With the discovery of transposable P-elements, transgenes can easily be inserted into fly genome. This led to creation of the GAL4-UAS system, described below, which I used to characterize Slik signaling pathway in the Drosophila wing imaginal disc.
1.3.1 GAL4-UAS system
The GAL4-UAS system makes it possible to express genes in Drosophila in a targeted manner, and has made flies the most tractable metazoan system to study gene functionality implicated in a wide range of processes. GAL4 is a yeast Saccharomyces cerevisiae transcriptional activator required for stimulating transcription of genes essential for galactose metabolism. GAL4 can be expressed in Drosophila without obvious phenotypic damage (Brand & Perrimon, 1993). This led to the creation of the GAL4-UAS system in Drosophila, based on a collection of GAL4-carrying P-elements randomly inserted throughout the genome (Brand and Perrimon 1993, Duffy 2002). Nearby genomic enhancers drive expression of the GAL4 gene in a specific pattern (Figure 1.6A). The GAL4 binds to a cis-acting regulatory sequence called Upstream Activating Sequences (UAS). By placing the UAS upstream of a gene-of-interest and transforming this into flies, it becomes possible to drive GAL4-dependent expression of the gene. When GAL4-expressing flies are mated to flies bearing a UAS-transgene, progeny inheriting both GAL4 and UAS transgenes will express the target gene in a spatial and temporal pattern defined by the enhancer regulating GAL4 expression. For example, when crossed to UAS-GFP transgenic flies, apGAL4 drives GFP expression in the dorsal half of the DP layer of the disc, but not in ventral cells or in the PM, both of which do
23
not express ap (Figure 1.6B). Another driver, ptcGAL4 drives expression of GFP specifically in a central stripe of DP cells (Figure 1.6C). A nice feature of these systems is that the part of the discs not expressing the transgenes can serve as an internal control. This facilitates comparisons, for example by immunofluorescence.
24
Figure 1.6: The GAL4-UAS system expressing transgenes specifically in DP cells.
(A) Schematic representation of the GAL4-UAS system. GAL4 is expressed under the control
of an enhancer. The gene of interest is coupled with UAS sequence and a minimal promoter, which is silent in the absence of GAL4. Once mated, the enhancer will drive expression of GAL4, which then binds to its binding site, UAS, and drives transcription of the target gene in a tissue-specific manner determined by the enhancer. (B) The enhancer ap is only active in the dorsal compartment of the wing discs. Thus expression of GFP driven by apGAL4 is only detected in the dorsal half of the DP layer of the disc. No expression is detected in PM cells (arrow). (C) The enhancer ptc drives is active in a central stripe of DP cells. Therefore, ptcGAL4 drives expression of GFP only in this central area, and not in PM cells (arrow).
A
B
C
Dorsal
25
2. Objectives
Understanding mechanisms controlling growth during development is important as it will provide insights into how coordination of both extrinsic and intrinsic cues regulates tissue homeostasis. The discovery of Slik as a regulator of tissue growth rate during development in Drosophila, suggests that its mammalian homologue may play a similar role. Therefore, it is of great interest to characterize the Slik signaling pathway, which will allow a better understanding of the role of these kinases in human physiology and disease. Though several components required for Slik to promote epithelial integrity have been identified, the mechanism through which this kinase drives non-autonomous cell proliferation and ultimately tissue growth remains elusive. The main objective of my thesis work was to identify the mechanism of Slik growth regulation using genetic and transcriptomic assays. Specifically, I set out to address three questions:
- Does Slik signal through the Hippo pathway? It has been shown that Slik directly phosphorylates Mer, thereby inhibiting Mer activity and driving cell proliferation and tissue growth (Hughes and Fehon 2006). I investigated if there was any genetic interaction between Slik and Mer.
- What is the relationship between Slik and dRaf? dRaf has been identified previously as one possible interacting partner of Slik (Hipfner and Cohen 2003). I investigated in which tissue dRaf is required in Slik signal transmission.
- What are the other effectors of Slik? Using transcriptomics, I set out to identify potential downstream targets of Slik.
26
3. Results
3.1 Does Slik signal through the Hippo pathway?
It was shown that Slik phosphorylates Mer, leading to its inactivation and mis-localization (Hughes and Fehon 2006). Loss of Mer membrane polarization inhibits Hpo activity, therefore leading to increased Yki transcriptional activity. Hence, although not tested, it has been suggested that Slik-driven cell proliferation leading to tissue growth acts through the Hippo pathway. Intriguingly, the kinase dead form of Slik, SlikKD, also drives non-autonomous cell proliferation, suggesting that kinase activity of Slik is dispensable (Hipfner and Cohen 2003). To resolve this apparent contradiction, I set out to test whether Slik acts through the Hippo pathway, via Mer and/or Yki.
3.1.1 Inhibition of Merlin does not drive non-autonomous proliferation of PM cells
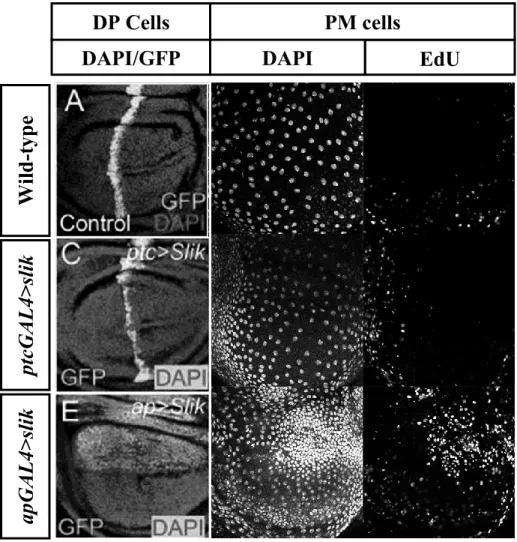
Previously, to characterize the role of Slik in Drosophila epithelial cells during development, we expressed slik using ptcGAL4, which is expressed in a stripe of DP cells in the middle of the wing imaginal discs (Figure 1.6). These discs were dissected, labelled with EdU, stained with DAPI, and visualized by confocal microscopy. DAPI stains nuclear DNA and EdU labels cells undergoing DNA synthesis (Figure 3.1). The peripodial layer of control discs expressing GFP using ptcGAL4 showed scattered nuclei indicative of broadly spread squamous cells. These PM cells were generally quiescent, reflected by low EdU labeling. In contrast, the PM of discs expressing slik showed densely packed nuclei and overproliferation evidenced by an increased number of DAPI positive nuclei and EdU labeling of cells overlying the ptcGAL4 stripe in the DP. This suggests that Slik drives proliferation of PM cells in a cell non-autonomous manner. To demonstrate that this effect was due to leaky expression of GAL4 in PM cells, we used another DP cell-specific driver, apGAL4 (Figure 1.6), to express slik in developing wings. Again, we saw an increase in DAPI-positive cells and EdU incorporation in the PM in slik-expressing discs compared to the control. Interestingly, the observed phenotype is more robust as evidenced by more DAPI-positive nuclei and EdU labeling compared to discs expressing slik under the control of ptcGAL. apGAL4 appears to be a stronger driver of transcription, perhaps because it drives gene expression in the whole dorsal compartment of the discs. Therefore, the number of DP cells
27
overexpressing Slik is larger with apGAL4 compared to ptcGAL4. It is important to note that the overproliferation of the PM cells is observed mainly in cells overlying the DP cells expressing the Slik transgene. We conclude that slik expression in DP cells does indeed drive non-autonomous proliferation of the PM cells.
As mentioned above, it has been suggested that Slik phosphorylates Merlin, thereby inhibiting it, leading to an increase in cell proliferation and tissue growth (Hughes & Fehon, 2006). If so, we reasoned that suppressing Merlin directly, either by expressing a dominant negative form of mer (mer∆BB ) or depleting it by expressing a long double-stranded RNA (dsRNA) targeting mer (referred to as merRNAi) should replicate the non-autonomous effects observed when slik is overexpressed. To test this hypothesis, I dissected wing imaginal discs from third instar larvae bearing the GAL4 driver alone or expressing slik, mer∆BB, or merRNAi. As expected, we observed elevated DAPI staining and EdU labelling in the overlaying peripodial cells in discs overexpressing slik compared to control (Figure 3.2A). In contrast, the PM of discs expressing the dominant negative form of mer looked like the PM of discs expressing apGAL4 alone, where DAPI and EdU labelling showed large quiescent cells (Figure 3.2B). The few cells undergoing proliferation are DP cells located at the edges of the disc. Similarly, when, I depleted mer in the wing imaginal discs by expressing merRNAi with apGAL4, DAPI staining and EdU labeling of PM cells were normal (Figure 3.2B). We note that both mer transgenes drive robust tissue overgrowth in the wing (see below and data not shown). However, depletion of mer does not induce non-autonomous proliferation of PM cells. The inability of Mer suppression to phenocopy Slik overexpression suggests that Slik driven non-autonomous proliferation does not result from inhibiting Mer activity.
28
Figure 3.1: Slik drives non-autonomous proliferation of PM cells
Confocal images of wing imaginal discs expressing GFP alone (wild-type) or together with Slik, using ptcGAL4 and apGAL4. Discs were stained with DAPI and GFP, and labeled with EdU.GFP is expressed in the DP cells. The peripodial layer of wild-type discs show large cells undergoing little proliferation suggested by low EdU incorporation. Overexpression of Slik drives proliferation of the PM cells as evidenced by the abnormal cluster of DAPI-positive cells and the increase in EdU incorporation overlying the Slik-expressing DP cells. Note DP and PM images are not from the same discs. N= more than 5 discs.
Wi
ld
-t
ype
pt
cG
AL
4>
sl
ik
ap
G
AL
4>
sl
ik
DAPI/GFP
DP Cells
EdU
DAPI
PM cells
29
Figure 3.2: Inhibition of Merlin does not stimulate non-autonomous proliferation of PM cells
(A-B) Confocal images of the peripodial membrane of wing imaginal disc expressing slik,
merΔBB, or merRNAi (dsRNA targeting meri) with apGAL. Discs were stained with DAPI and labeled with EdU. (A) PM cells show normal physiology in discs expressing apGAL4 alone. Slik overexpression drives non-autonomous proliferation of PM cells. (B) In discs expressing merΔBB or merRNAi, the peripodial layer is similar to the wild-type disc, where DAPI-positive cells are scattered and the little EdU uptake (upper panel and lower panel respectively).
G
A
B
ap
G
AL
4>
sl
ik
ap
G
AL
4
apG A L4> m er R N A i apG A L4> m er ∆ BBDAPI
EdU
DAPI
EdU
30
3.1.2 Inhibiting Merlin does not enhance Slik overexpression effects
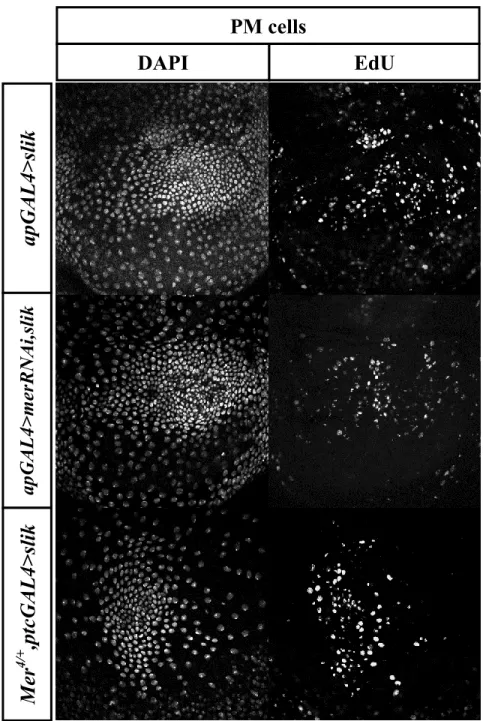
Another method to test whether Slik signals through Mer is to investigate for genetic interactions. Genetic interaction is observed when alterations in two genes produce a phenotype that is different than alteration of either gene individually (St Johnston 2002). Therefore, we scrutinized whether inhibiting Mer would affect the Slik-driven non-autonomous proliferation of PM cells. In wing imaginal discs co-expressing slik and merRNAi with apGAL4, we observed an increase in DAPI-positive nuclei and EdU incorporation compared to peripodial layer of apGAL4 alone (Figure 3.3, upper panels). However, the extent of non-autonomous proliferation was not noticeably enhanced compared to expressing slik alone. Similarly, we investigated if reducing mer gene dosage would affect Slik driven cell proliferation. In mer+/-, we observed a similar increase in nuclei and proliferation in the PM upon slik overexpression as in a wild-type background (Figure 3.3, lower panels). We conclude that inhibition of Mer fails to enhance the Slik-driven non-autonomous proliferation of the PM cells, consistent with Slik acting through a different effector.
3.1.3 Slik does not regulate transcription of the Yorkie target gene expanded
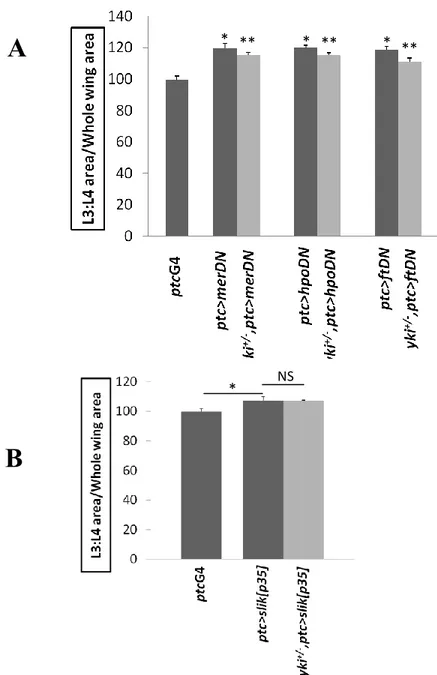
Although Mer not involved, we tested whether Hpo pathway could still be implicated. To achieve this, I looked for genetic interaction between Slik and Yki. The Hippo pathway restricts growth by negatively regulating Yki. Thus, if Slik inhibits the Hippo pathway, we expect it to promote Yki activity to drive cell proliferation and tissue growth. As readout of tissue growth, we measured the size of the Drosophila adult wings, which are sensitive to growth effects. ptcGAL4 drives genes expression between the third (L3) and fourth (L4) wing veins. The area enclosed between veins L3 and L4 as a ratio of the whole wing area gives a quantifiable value that is highly reproducible (Hipfner and Cohen 2003). The dominant negative forms of mer, hpo and ft drive tissue growth when expressed under a GAL4 driver and are used as control in this assay (LaJeunesse, McCartney et al. 1998, Wu, Huang et al. 2003, Matakatsu and Blair 2012). Expression of the dominant negative forms of each with ptcGAL4 increased the area bounded by veins L3 and L4 by about 20% (Figure 3.4A). This overgrowth was reduced by a small but highly significant amount when the transgenes were expressed in a yki heterozygous background (p<0.001), consistent with the function of Yki
31
Figure 3.3: Slik driven non-autonomous proliferation of PM cells is Merlin independent
Confocal images of the PM of wing imaginal discs expressing slik alone, coexpressing slik and merRNAi with apGAL4, or expressing slik with ptcGAL4 in a mer heterozygous background. Discs were stained with DAPI and labeled with EdU. Depletion of mer in slik overexpressing cells or overexpression of slik in a mer+/- background did not enhance the amount of the non-autonomous proliferation of PM cells. N= at least 4 discs for each genotype.