Combination of Capillary Electrophoresis and Ion mobility
coupled to Mass Spectrometry and Theoretical
Calculations for cysteine connectivity identification in
peptides bearing two intramolecular disulfide bonds
Cédric Delvaux
(1)
and Philippe Massonnet
(1)
, Christopher Kune
(1)
, Gregory Upert
(2)
, Gilles
Mourier
(2)
, Jean R.N. Haler
(1)
, Nicolas Gilles
(2)
, Loïc Quinton
(1)
, Johann Far
(1)
and Edwin de
Pauw
(1)
(1) Laboratory of Mass Spectrometry, University of Liege, Allée de la Chimie 3, B-4000 Liege, Belgium
(2) Commissariat à l’Energie Atomique, DSV/iBiTec – S/SIMOPRO, F91191 Gif-sur-Yvette, France
Context of the study : disulfide connectivity assignment
1) Context
2) Model
peptide
3) Apamin
4) Conotoxin
5) Modeling
6) Conclusion
•
Major post translational modification playing crucial roles in peptide
stabilization and protein structures
•
In some cases, the native disulfide pattern is essential for biological
activities
(1)or to preserve the biological activity
(2)•
Misfolded variants can lead to reduced biological activity
(2)and are
generally degraded or recycled by enzymes to the native form
(3)The presence of multiple disulfide bonds leads to various disulfide isomers/variants :
(1) Matsumura, M.; Signor, G.; Matthews, B. W. Nature 1989, 342 (6247), 291–293 (2) Wu, Y.; Wu, X.; Yu, J.; Zhu, X.; Zhangsun, D.; Luo, S. Molecules 2014, 19 (1), 966–979
SH
SH
SH
SH
SH
SH
Same amino acid
sequence but different
disulfide connectivities
Potential variable
biological activities
Characterization methods for S-S bonds connectivities
in peptides and proteins: State-of-the-art
1) Context
2) Model
peptide
3) Apamin
4) Conotoxin
5) Modeling
6) Conclusion
Method
Main Advantage
Main Drawback
X-Ray Crystallography
High structural resolution
Need for a crystal/fold
Nuclear Magnetic Resonance
High structural resolution
Large amount of sample needed
Bioinformatics
Only sequence is required
Not experimentally confirmed
Mass Spectrometry
Large number of approaches available
(MALDI-ISD, ETD, CID, IM-MS,
LC-MS/MS,…)
Complex spectral information
The use of Ion Mobility Spectrometry (IMS) for
disulfide connectivity identification
1) Context
2) Model
peptide
3) Apamin
4) Conotoxin
5) Modeling
6) Conclusion
Ion Mobility :
Separation
in the gas phase
according to both
charge (q) and collision cross section (Ω)
K: mobility in gas phase (m2.V-1.s-1)
q: charge of the ion (C) N: density number of buffer gas T: temperature (K) m: mass of buffer gas (Da) M: mass of ion (Da)
k: Boltzmann’s constant (1.38065.10-23J.K-1)
E
N2 N2 N2 N2 N2 N2 Mobility Cell N2 N2Courtesy of Bowers group
Projection approximation Felectric Ffriction N2 N2 N2 N2 C N C P K ET A L C R R A C Q Q H A N2
Mason-Schamp
Model peptide :
27-residue synthetic peptide containing 4 cysteines
with 3 possible intramolecular disulfide pairings
(conceptual rendering) :
1 SH SH C E G W F R F T K T G L E SH SH G W R C C Y C T P G L L K L 15 20 27 C E G W C R C G W F R F TK TG L E Y C T P G L L K L1) ModGlo
(Cys1-Cys20 / Cys15-Cys27)
C
1-C
3/ C
2-C
4 CE GWR C C G WF R F T K T G L E Y C T P G L L KL2) ModBea
(Cys1-Cys15 / Cys20-Cys27)
C
1-C
2/ C
3-C
4 G W C R C F R F TK TG L E Y C TP G L L K L3) ModRib
(Cys1-Cys27 / Cys15-Cys20)
C
1-C
4/ C
2-C
3K =
3q
16N
.
2π
kT
1 2.
m + M
mM
1 2.
1
Ω
= constant.
m + M
mM
1 2.
𝐪
𝛀
Published IM-MS method
(1)
on a synthetic model peptide
(1) Massonnet, P.; Haler, J. R. N.; Upert, G.; Degueldre, M.; Morsa, D.; Smargiasso, N.; Mourier, G.; Gilles, N.; Quinton, L.; De Pauw, E. 2016, 27 (10), 1637–1646
1) Context
2) Model
peptide
3) Apamin
4) Conotoxin
5) Modeling
6) Conclusion
ModGlo
(
Cys1-Cys20 / Cys15-Cys27
)
C
1-C
3/ C
2-C
4ModRib
(
Cys1-Cys27 / Cys15-Cys20
)
C
1-C
4/ C
2-C
3ModBea
(
Cys1-Cys15 / Cys20-Cys27
)
C
1-C
2/ C
3-C
4Mix of 3 model
peptides isomers at
equal concentrations
Ion Mobility Spectrometry and Capillary Electrophoresis :
mobility-based separation techniques
Ion Mobility :
Separation
in the gas phase
according to both
charge (q) and collision cross section (Ω)
Capillary Electrophoresis :
Separation
in solution
according to both charge (q)
(pH dependent) and hydrodynamic radius (R
h)
μe=
6πηR
q
h=
1
6πη
.
q
𝐑
𝐡E
N2 N2 N2 N2 N2 N2 Mobility Cell N2 N2Courtesy of Bowers group
Felectric Ffriction N2 N2 N2 N2 C N C P K ET A L C R R A C Q Q H A N2
+
HV supply-1) Context
2) Model
peptide
3) Apamin
4) Conotoxin
5) Modeling
6) Conclusion
F
electric
= F
friction
→ v
stat
=
mobility constant
. E
K =
3q
16N
.
2π
kT
1 2.
m + M
mM
1 2.
1
Ω
= constant.
m + M
mM
1 2.
𝐪
𝛀
BGE = 80mM formic acid in 20% isopropanol
30µm x 150µm x 90cm BFS @+30kV
CZE method development on a synthetic model peptide
1) Context
2) Model
peptide
3) Apamin
4) Conotoxin
5) Modeling
6) Conclusion
RMT = MT peptide / MT GluFib
15 16 17 18 19 20 21 22 23 24 25 26 27 28 29 30Time (min)
0 25 50 75 100R
elat
iv
e
Abu
nd
an
ce
17.98 18.98 18.45 26.01 RMT = 0,72972 ModRibGlufib = reference migration time
RMT = 0,70934 ModBea RMT = 0,69127 ModGloModGlo : C
1-C
3/C
2-C
4ModBea : C
1-C
2/C
3-C
4ModRib : C
1-C
4/C
2-C
3Determination of RMT (separate disulfide isomers)
σ
RMT = relative migration time = standard deviation
n = number of replicates Peptide RMT (n=6) σ (n=6) %σ (n=6) ModGlo 0,69741 0,00158 0,23% ModBea 0,70650 0,00088 0,12% ModRib 0,72882 0,00110 0,15% 0.69 0.70 0.71 0.72 0.73 0.74
0.5
ModGlo
1.5ModBea
2.5ModRib
3.5RMT to
G
lufib
Determination of RMT (mix of the disulfide isomers)
Peptide RMT (n=6) σ (n=6) %σ (n=6)
ModGlo 0,69388 0,00217 0,31%
ModBea 0,71225 0,00228 0,32%
ModRib 0,73169 0,00185 0,25%
RMT = relative migration time σ = standard deviation n = number of replicates 0.69 0.70 0.71 0.72 0.73 0.74
0.5
ModGlo
1.5ModBea
2.5ModRib
3.5RMT to
G
Expanding the method to biologically relevant peptides :
apamins
1
st
biologically relevant peptide : Apamin
Naturally occurring 18-residue peptide contained in the venom of bees
With 3 possible intramolecular disulfide pairings (conceptual rendering) :
(Cys1 – Cys11 / Cys3 – Cys15)
C
1-C
3/C
2-C
4Naturally occuring Apamin
(Cys1 – Cys15 / Cys3 – Cys11)
C
1-C
4/C
2-C
3Purely synthetic
(Cys1 – Cys3 / Cys11 – Cys15)
C
1-C
2/C
3-C
4Purely synthetic
C N C P K E T A L C R R A C Q Q H A C N C K P E T A L C A R R C Q Q H A CN CK P E T A L CA R R C Q Q H A SH SH SH SHApaRib
Apamin
ApaBea
-CO-NH2
N
ter 1 3 11 15 C N C K A P E T A L C A R R C Q Q H1) Context
2) Model
peptide
3) Apamin
4) Conotoxin
5) Modeling
6) Conclusion
IM-MS/MS results of the apamins
3.00 3.50 4.00 4.50 5.00 5.50 6.00 6.50 % 0 100 4.85 [M+4H+]4+ApaBea
C
1-C
2/C
3-C
4 Drift Time (ms) 3.00 3.50 4.00 4.50 5.00 5.50 6.00 6.50 % 0 100 4.41 [M+4H+]4+Apamin
C
1-C
3/C
2-C
4 Drift Time (ms) 3.00 3.50 4.00 4.50 5.00 5.50 6.00 6.50 % 0 100 4.41 4.96 [M+4H+]4+ApaRib
C
1-C
4/C
2-C
3 Drift Time (ms) 3.00 3.50 4.00 4.50 5.00 5.50 6.00 6.50 % 0 100 4.41 4.85 [M+4H+]4+Mix of ApaRib,
Apamin
and ApaBea
Drift Time (ms) y13 y14 y12 y11 y10 y9 y8 [y13]3+ [y9]2+ [y10]2+ [y11]2+ [y12]2+ [y13]2+ [y14 ]2+ m/z 400 450 500 550 600 650 700 750 800 850 900 950 1000 % 0 100 706.90 755.43 642.38 503.95 591.84 556.32 790.95 [M-APETA-H2O]3+ [M-APET or PETA-H2O]3+ [M-KAPE TAL-H2O]2+ [M+4H+]4+ [ M-PE-H2O]3+ [M-KAPET-H2O]2+ [M-KAPE-H2O]2+ m/z 400 450 500 550 600 650 700 750 800 850 900 950 1000 % 0 100 543.62 507.77 519.94 [M-PET-H2O]3+ 567.30 759.38 600.98 723.87 809.92 667.29 874.40 929.94 [M-KAPE TA-H2O]2+ m/z 400 450 500 550 600 650 700 750 800 850 900 950 1000 % 0 100 874.40 929.94 [M-APETA-H2O]3+ 519.91 [M+4H+]4+ 507.49 [M-APET or PETA-H2O]3+ 543.59 [M-PET-H2O]3+ 567.28 [ M-PE-H2O]3+ 600.96 [M-KAPE TAL-H2O]2+ 667.29 723.84 [M-KAPE TA-H2O]2+ [M-KAPE-H2O]2+ 809.92 [M-KAPET-H2O]2+ 759.35MS/MS spectra
1) Context
2) Model
peptide
3) Apamin
4) Conotoxin
5) Modeling
6) Conclusion
C N CK P E T A L C A R R C Q Q H A ApaRib: C1-C4/C2-C3 C N C P K ET A L C R R A C Q Q H A Apamin: C1-C3/C2-C4 CN CK PE T A L CA RR C Q Q H A ApaBea: C1-C2/C3-C4CZE-MS results of the apamins in an
acidic
buffer
R MT to G lu fib 0.45 0.47 0.49 0.51 0.53 0.55 0.45 0.47 0.49 0.51 0.53 0.55Determination of RMT (separate disulfide isomers)
RMT = relative migration time σ = standard deviation n = number of replicates
Determination of RMT (mix of the disulfide isomers)
RMT = relative migration time σ = standard deviation n = number of replicates R MT to G lu fib Peptide RMT (n=6) σ (n=6) %σ (n=6) ApaRib 0,46764 0,00086 0,18% Apamin 0,49250 0,00075 0,15% ApaBea 0,52866 0,00312 0,59% Peptide RMT (n=6) σ (n=6) %σ (n=6) ApaRib 0,47529 0,00154 0,32% Apamin 0,48571 0,00211 0,43% ApaBea 0,52124 0,00169 0,32%
BGE =
100mM formic acid
10 11 12 13 14 15 16 17 18 19 20 21 22 23 24 25 26 27 Time (min) 0 25 50 75 100 R elati ve Abundance 12.09 13.27 12.31 25.47 RMT = 0,47468 ApaRib RMT = 0,48331 Apamin RMT = 0,52101 ApaBea Glufib
30µm x 150µm x 90cm BFS @+30kV
1) Context
2) Model
peptide
3) Apamin
4) Conotoxin
5) Modeling
6) Conclusion
1) Context
2) Model
peptide
3) Apamin
4) Conotoxin
5) Modeling
6) Conclusion
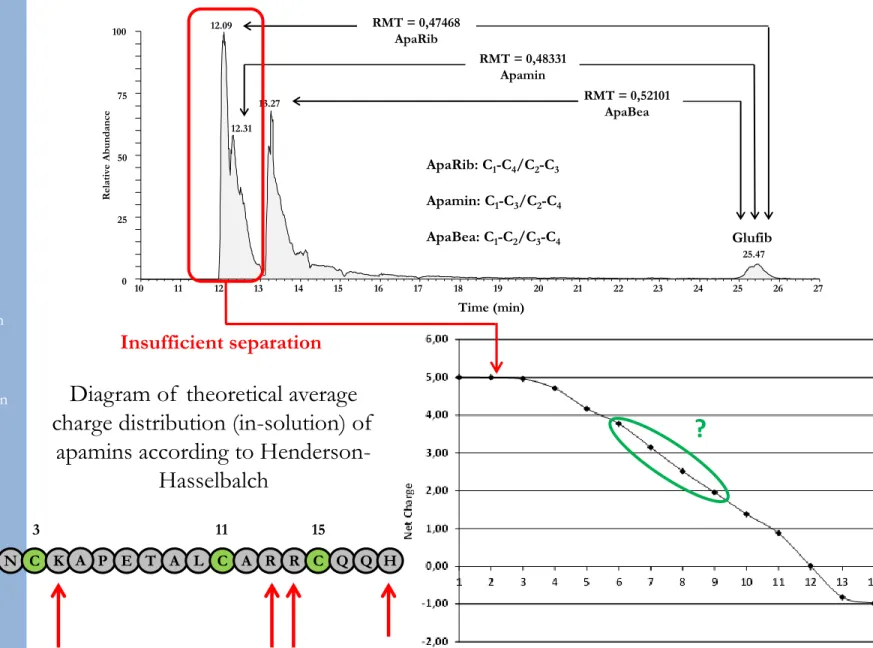
Could pH optimization of the buffer improve the CZE-MS
separation of the apamins ?
ApaRib: C1-C4/C2-C3 Apamin: C1-C3/C2-C4 ApaBea: C1-C2/C3-C4 10 11 12 13 14 15 16 17 18 19 20 21 22 23 24 25 26 27 Time (min) 0 25 50 75 100 R elati ve Abundance 12.09 13.27 12.31 25.47 RMT = 0,47468 ApaRib RMT = 0,48331 Apamin RMT = 0,52101 ApaBea Glufib
Insufficient separation
?
Diagram of theoretical average
charge distribution (in-solution) of
apamins according to
Henderson-Hasselbalch
1 3 11 15
C N C K A P E T A L C A R R C Q Q H
Nter
CZE-MS results of the apamins in a
neutral
buffer
0.84 0.86 0.88 0.90 0.92 0.94 0.96 0.98 0.84 0.86 0.88 0.90 0.92 0.94 0.96 0.98 R MT to MR FADetermination of RMT (separate disulfide isomers)
RMT = relative migration time σ = standard deviation n = number of replicates
Determination of RMT (mix of the disulfide isomers)
RMT = relative migration time σ = standard deviation n = number of replicates RMT to MRFA Pe ptide RMT (n=6) σ (n=6) %σ (n=6) Apamin 0,86142 0,00199 0,23% ApaRib 0,88990 0,00376 0,42% ApaBe a 0,96019 0,00644 0,67% Pe ptide RMT (n=6) σ (n=6) %σ (n=6) Apamin 0,85550 0,00230 0,27% ApaRib 0,88404 0,00292 0,33% ApaBe a 0,91875 0,00133 0,15%
BGE =
NH
4
Ac 50mM pH 7
Time (min) 0 25 50 75 100 R el ativ e Abundanc e(1) : RMT = 0,85460 → Apamin (C
1-C
3/C
2-C
4)
(2) : RMT = 0,88172 → ApaRib (C
1-C
4/C
2-C
3)
(1) : RMT = 0,91774 → ApaBea (C
1-C
2/C
3-C
4)
15 16 17 18 19 20 21 22 23 24 25 26 27 28 29 30 19.22 20.64 19.83 MRFA (1) 22.49 (2) (3)MRFA = reference migration time
(Glufib is anionic at pH=7)
30µm x 150µm x 90cm BFS @+20kV
1) Context
2) Model
peptide
3) Apamin
4) Conotoxin
5) Modeling
6) Conclusion
Expanding the method to biologically relevant peptides :
conotoxins
2
nd
biologically relevant peptide : α and χ conotoxins
Naturally occurring 11-residue peptide contained in the venom of marine cone snails
With 2 possible intramolecular disulfide pairings (conceptual rendering) :
SH
SH
SH
SH
C C
H
S
S W C K H L C
1 2 7 11 C C S H S W C K H L CConotoxin χ
(Cys1 – Cys11 / Cys2 – Cys7) C1-C4/ C2-C3 Naturally occuring C C S H S W C K H L C
Conotoxin α
(Cys1 – Cys7 / Cys2 – Cys11) C1-C3/ C2-C4 Purely synthetic
1) Context
2) Model
peptide
3) Apamin
4) Conotoxin
5) Modeling
6) Conclusion
C C H S S W C K H L C
b7 b8 b9 b10 W 159.10 H [M + 2H+]2+ m/z 100 200 300 400 500 600 700 800 900 1000 1100 1200 1300 % 0 100 110.07 651.76 223.16HL-28 [y9 2SH]2+ 549.71 [M-CO + 2H+]2+ 637.70 [a7 1SH]+ 777.29 [b7 1SH]+ 805.29 [b8 1SH]+ 933.35 [b9 1SH - H2O]+ 1054.36 [b10 1SH - H2O]+ 1165.44 [M + 2H+]2+ m/z 100 200 300 400 500 600 700 800 900 1000 1100 1200 1300 % 0 100 H 110.08 651.77 [b9 1SH - H2O]+ 1054.36 W 159.10 [y9 2SH]2+ 549.71 [y31SH]+ 372.18 HL-28 223.17 [b10 1SH - H2O]+ 1165.46 [a9 1SH]2+ 521.72 [M-CO + 2H+]2+ 637.70 [b7 1SH]+ 805.29 [b8 1SH]+ 933.35 [a7 1SH]+ 777.29 % 0 100 6.65 6.00 6.50 7.00 7.50 8.00 Drift Time (ms)[M+2H
+]
2+α conotoxin
C
1-C
3/C
2-C
4 % 0 100 7.06 6.00 6.50 7.00 7.50 8.00 Drift Time (ms)[M+2H
+]
2+χ conotoxin
C
1-C
4/C
2-C
3 % 0 100 7.06 6.65 6.00 6.50 7.00 7.50 8.00[M+2H
+]
2+ Drift Time (ms)Mix conotoxins
(B)
(C)
(A)
IM-MS/MS results of α and χ conotoxins
MS/MS spectra
1) Context
2) Model
peptide
3) Apamin
4) Conotoxin
5) Modeling
6) Conclusion
C C H S S W C K H L C
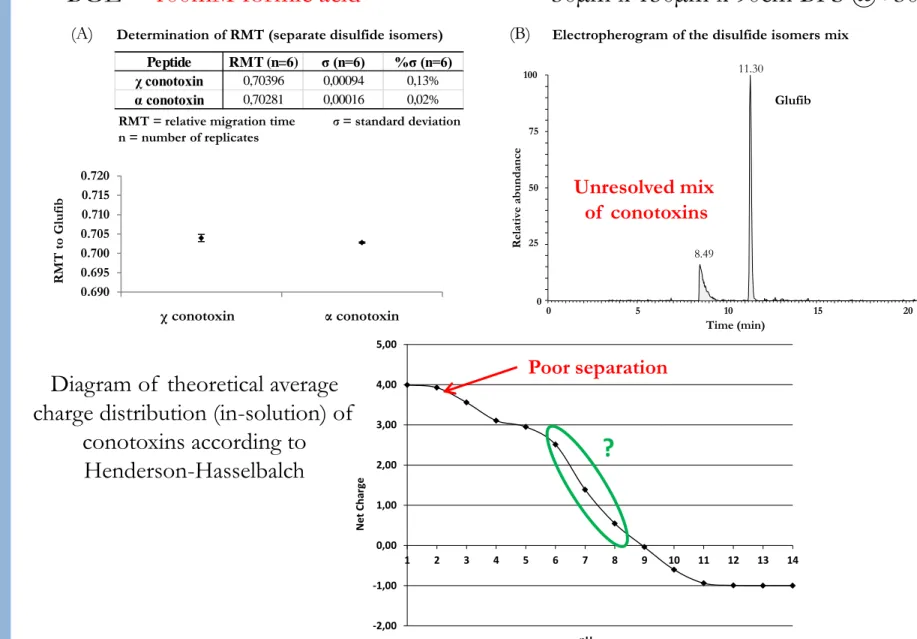
b7 b8 b9 b10CZE-MS results of the conotoxins in an
acidic
buffer
-2,00 -1,00 0,00 1,00 2,00 3,00 4,00 5,00 1 2 3 4 5 6 7 8 9 10 11 12 13 14 N et C ha rg e pHPoor separation
?
BGE =
100mM formic acid
Diagram of theoretical average
charge distribution (in-solution) of
conotoxins according to
Henderson-Hasselbalch
30µm x 150µm x 90cm BFS @+30kV
1) Context
2) Model
peptide
3) Apamin
4) Conotoxin
5) Modeling
6) Conclusion
Determination of RMT (separate disulfide isomers)
RMT = relative migration time σ = standard deviation n = number of replicates
Electropherogram of the disulfide isomers mix
R MT to Gl uf ib 0.690 0.695 0.700 0.705 0.710 0.715 0.720 0.00 1.00 2.00 Peptide RMT (n=6) σ (n=6) %σ (n=6) χ conotoxin 0,70396 0,00094 0,13% α conotoxin 0,70281 0,00016 0,02%
(A)
χ conotoxin α conotoxin(B)
0 5 10 15 20 Time (min) 0 25 50 75 100 R el ativ e abundanc e 11.30 8.49 GlufibUnresolved mix
of conotoxins
CZE-MS results of the conotoxins in a
neutral
buffer
(C)
Determination of RMT (separate disulfide isomers)
RMT = relative migration time σ = standard deviation n = number of replicates
(A)
Determination of RMT (mix of the disulfide isomers)RMT = relative migration time σ = standard deviation n = number of replicates