University of Liege Faculty of Applied Sciences
ArGEnCo Department
Thesis submitted for the degree of
Doctor of Philosophy in Applied Sciences
Shallow geothermal energy: effect of in-situ conditions on
borehole heat exchanger design and performance
by
Georgia Radioti
2016
JURY
Frédéric Collin (President) Robert Charlier (Supervisor) Frédéric Nguyen (Co-supervisor) Pierre Dewallef Bertrand François Fleur Loveridge Anh Minh Tang Vincent Vandenheede
Université de Liège Université de Liège Université de Liège Université de Liège
Université Libre de Bruxelles University of Leeds
Université Paris-Est Geolys SPRL
This research was funded by:
F.R.I.A. - F.R.S. - FNRS
Fonds pour la formation à la Recherche dans l'Industrie et dans l'Agriculture
Service public de Wallonie (SPW)
Direction générale du territoire, Logement, Patrimoine et Energie (DGO4)
Acknowledgements
First, I would like to thank my supervisor Robert Charlier for his guidance, his advices and for the opportunities that he offered me during this thesis. I thank my co-supervisor Frédéric Nguyen for his significant contribution and the members of my thesis committee, Bertrand François and Frédéric Collin, for their interesting comments and suggestions. I also thank all the members of my Ph.D. jury for accepting revising my thesis.
Special thanks to Benjamin Cerfontaine for developing and implementing in LAGAMINE the 1D finite element formulation for borehole heat exchangers, to Simon Delvoie for his contribution in the geological interpretation of the site and to Kévin Sartor for providing the feeder pipe heat loss data. Without their contribution this work would not be possible. I also thank Pierre Illing for his assistance in the laboratory measurements.
I would like to acknowledge the financial support of the F.R.S.-FNRS (F.R.I.A. fellowship) and of the Walloon Region (GeoTherWal project, n° 1117492), as well as the company REHAU for providing the pipes and the commercial grouting materials and the University service ARI for their support in the installation of the BHEs. I thank our partners in the project, the ULB (Bertrand François and Selçuk Erol) and the companies Geolys (Vincent Lejeune, Vincent Vandenheede and Geoffrey Poulain) and OREX (Vincent Fiquet) for the fruitful collaboration.
Special thanks to Anne-Catherine, with whom we shared the office for four years, for her help and the joyful conversations, as well as to Sanae for the nice environment during the last months of this thesis. I would like to thank all the members of the group for their warm welcome, the friendly environment and the nice discussions. Τέλος, θα ήθελα να ευχαριστήσω την οικογένεια μου και τους φίλους μου για την συνεχή τους υποστήριξη κατά τη διάρκεια της εκπόνησης της εργασίας αυτής.
i
Abstract
The in-situ conditions are critical for the performance of Borehole Heat Exchangers (BHEs). However, in practise they are often not adequately considered, overwhelming the potential of these systems. This thesis focuses on the accurate estimation of the in-situ characteristics and on their influence on the design and the behaviour of BHEs based on an in-situ study of an heterogeneous bedrock in a semi-urban environment (campus of the University of Liege, Liege, Belgium). The experimental site consists of four double-U BHEs, of about 100 m long, installed over a surface area of 32 m² and equipped with fiber optic cables. Several temperature measurements and Distributed Thermal Response Tests (DTRTs) were conducted in situ in a period of four years, including a long-duration DTRT (heating phase of 7 months), during which temperature was measured by the fiber optics in all the four boreholes. These measurements create a unique data set, that allows to investigate the BHE behaviour for longer heating periods, to study the effect of various factors on the temperature field evolution at the heterogeneous bedrock at the in-situ scale and to evaluate the contribution of temperature borehole logging to the optimisation of BHEs.
The effect of urbanisation is studied based on the in-situ measurements and on 3D numerical modelling and its influence on the design is expressed in terms of the maximum extracted power. The subsurface characteristics are correlated with the measured fiber optic profiles and the potential of temperature borehole logging for optimising the design of BHEs in practise is presented. The accuracy of the thermal response test results in the case of insufficient test rig insulation is investigated and recommendations are provided regarding the interpretation of the data by the widely applied Infinite Line Source model. The in-situ measurements during the long-duration DTRT are presented and analysed, together with a 3D numerical model of the test. In this case-study, the possible variation of the effective thermal conductivity along the layers and the air temperature variations during the test do not seem to have a dominant effect on the BHE behaviour during the whole heating phase. The controlling factors for the temperature field evolution in the surrounding rock mass (bedrock heterogeneity, the air temperature variations, the distance to the heating source and the thermal effects at the borehole bottom end) are detected in the measured profiles and their influence is discussed.
ii
Résumé
Les conditions in-situ sont cruciales pour la performance des forages géothermiques (borehole heat exchangers, BHEs). Néanmoins, dans la pratique elles ne sont souvent pas suffisamment prises en compte, limitant le potentiel de ces systèmes. Cette thèse se concentre sur l'estimation précise des caractéristiques in situ et sur leur influence sur la conception et le comportement des BHEs. Une étude in situ a été entreprise dans un bedrock hétérogène et dans un milieu semi-urbain (campus de l'Université de Liège, Liège, Belgique). Le site expérimental est constitué de quatre sondes géothermiques en double-U, d'une longueur de 100m, installées sur une surface de 32 m² et équipées de fibres optiques. Sur une période de quatre ans, plusieurs mesures de température ont été réalisées en tête de forage (test de réponse thermique, TRT) et le long de celui-ci grâce aux fibres optiques (DTRT). Elles incluent un DTRT de longue durée (phase de chauffage de 7 mois), au cours duquel la température a été mesurée par fibres optiques dans les quatre forages. L’ensemble de ces mesures forment une base de données unique, qui permet d'étudier le comportement des BHEs pour des périodes de chauffage plus longues, d'étudier l'effet de divers facteurs sur le champ de température dans le bedrock hétérogène à l'échelle in situ et d'évaluer la contribution de diagraphies thermiques à l'optimisation des BHEs.
L'effet de l'urbanisation est étudié sur base des mesures in situ et sur la modélisation numérique 3D. Son influence sur la conception est exprimée en termes de puissance extraite maximale. Les caractéristiques du sous-sol sont corrélées avec les profils de température et le potentiel de diagraphies thermiques pour optimiser la conception de BHEs dans la pratique est présenté. La précision des résultats des tests de réponse thermique dans le cas de l'isolation insuffisante du module est étudiée et des recommandations sont fournies en ce qui concerne l'interprétation des données par le modèle largement utilisé de la ligne source infinie (ILS). Les mesures in situ au cours du DTRT de longue durée sont présentées et analysées, ainsi qu'un modèle numérique 3D du test. Dans cette étude de cas, la variation possible de la conductivité thermique effective le long des couches et les variations de température de l'air pendant l'essai ne semblent pas avoir un effet dominant sur le comportement du BHE pendant toute la phase de chauffage. Les facteurs critiques de l'évolution du champ de température dans la masse rocheuse environnante (hétérogénéité, variations de température de l'air, distance à la source de chaleur et effets thermiques à l'extrémité inférieure du forage) sont détectés dans les profils mesurés et leur influence est discutée.
iii
Contents
Abstract ... i
Résumé ... ii
List of symbols and abbreviations ... vii
Chapter 1 - Introduction
1.1 Uses of shallow geothermal energy ... 11.2 Benefits and limitations ... 6
1.3 Literature review ... 10
1.3.1 Undisturbed ground temperature: in-situ determination and urbanization effect ... 11
1.3.2 Thermal Response Test and interpretation by the Infinite Line Source model ... 15
1.3.3 Variation of ground thermal properties ... 21
1.3.3.1 Distributed Thermal Response Test ... 22
1.3.3.2 Recovery profiles analysis ... 24
1.4 Objectives of the thesis ... 25
1.5 Outline of the thesis ... 27
Chapter 2 - Experimental site: geological interpretation and cuttings
thermal conductivity
2.1 Site location and installation procedure ... 302.2 Geological interpretation ... 34
2.2.1 Preliminary geological investigation ... 34
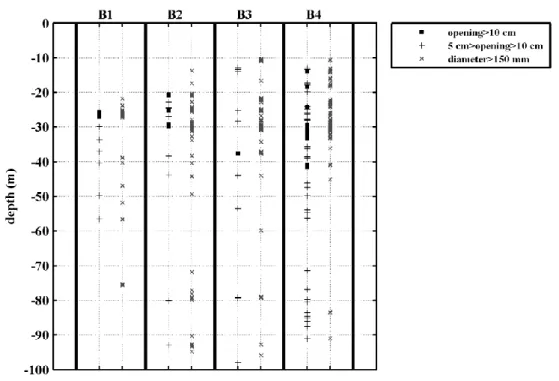
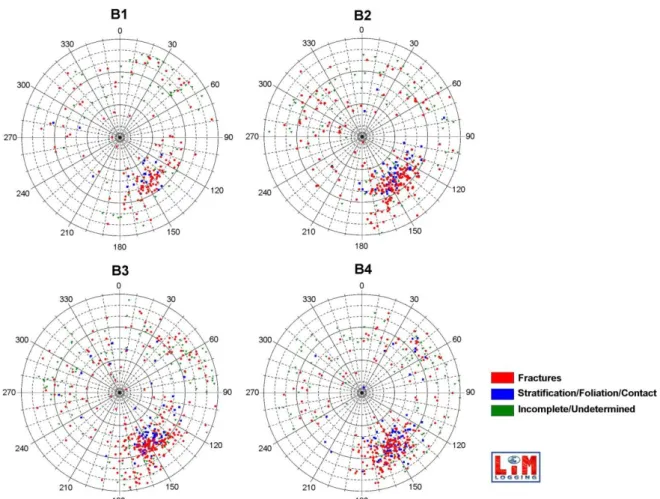
2.2.2 Borehole logging method ... 35
2.2.2.1 Fracture characterisation ... 36
2.2.2.2 Rock identification ... 39
iv
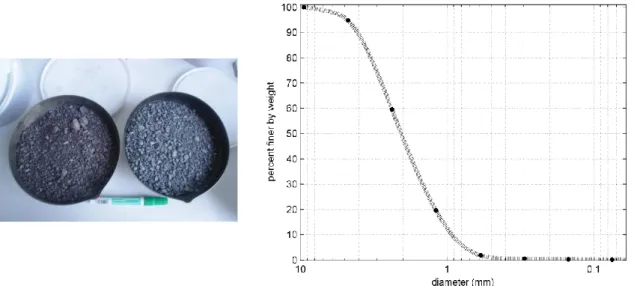
2.3 Cuttings thermal conductivity ... 43
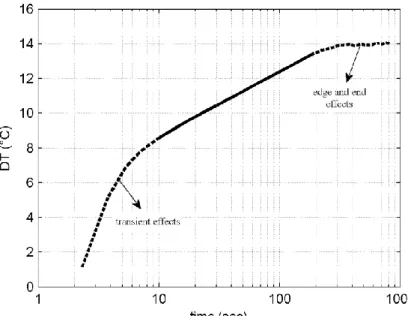
2.3.1 Thermal needle probe procedure ... 43
2.3.2 Thermal conductivity measurements analysis ... 46
2.4 In-situ temperature measurements and tests ... 49
2.5 Conclusions ... 51
Chapter 3 - Fiber optic temperature measurements accuracy
3.1 Introduction ... 533.2 Distributed Temperature Sensing technique ... 53
3.3 Fiber optic profiles calibration ... 54
3.4 Fiber optic profiles accuracy ... 59
Chapter 4 - Undisturbed ground temperature in a semi-urban environment
4.1 Introduction ... 624.2 Undisturbed ground temperature profiles by borehole logging ... 63
4.2.1 In-situ measurements ... 63
4.2.2 Analytical estimation ... 65
4.2.3 Numerical modelling: effect of urbanization... 67
4.2.3.1 Geometry and boundary conditions ... 67
4.2.3.2 Results and impact on the design ... 68
4.2.3.3 Representativeness of the model ... 72
4.3 Temperature measurements during water circulation in the pipe loops ... 73
4.3.1 Temperature sensors measurements: impact of rig insulation ... 74
4.3.2 Fiber optic measurements ... 78
v
Chapter 5: DTRT measurements analysis: impact of heat input oscillations,
in-situ grouting thermal conductivity and bedrock heterogeneity detection
5.1 Introduction ... 81
5.2 Heat input oscillations effect on ILS model results ... 83
5.2.1 Impact of test rig insulation ... 83
5.2.2 ILS model assumptions and limitations... 88
5.2.3 Investigation for different data intervals ... 93
5.3 Calibration of in-situ grouting thermal conductivity by numerical modelling ... 98
5.3.1 Geometry and boundary conditions ... 98
5.3.2 Results and comparison with proposed values ... 102
5.4 Temperature distribution inside the borehole ... 107
5.4.1 Heating phase ... 107
5.4.2 Recovery phase ... 111
5.5 Detection of bedrock heterogeneity and layer dip angle determination ... 113
5.5.1 Temperature profiles during hardening of the grouting material ... 113
5.5.2 Temperature profiles during the recovery phase ... 116
5.6 Conclusions ... 121
Chapter 6: Long-duration DTRT and thermal plume in the surrounding
bedrock
6.1 Introduction ... 1236.2 Applied phases and fiber optic measurements calibration ... 125
6.3 Bedrock thermal behaviour investigation: fiber optic profiles of the heated BHE ... 132
6.3.1 During the heating phase ... 132
6.3.2 During the recovery phase ... 139
6.4 Numerical modelling ... 143
vi
6.4.2 Results ... 148
6.4.2.1 Water temperature evolution: effect of heat input interruptions ... 150
6.4.2.2 Comparison with fiber optic profiles ... 158
6.5 Thermal plume in the surrounding heterogeneous bedrock ... 161
6.5.1 Numerical investigation ... 163
6.5.2 Measured temperature evolution ... 167
6.5.2.1 Bedrock heterogeneity and anisotropic thermal behaviour ... 173
6.6 Conclusions ... 180
Chapter 7: Conclusions and perspectives
7.1 Summary ... 1847.2 Recommendations for BHE installations in practise ... 188
7.3 Perspectives for future research ... 190
References ... 193
Appendix A: Drilling parameters logs for the four boreholes ... 201
Appendix B: Formulation of a 1D finite element of heat exchanger for accurate modelling of the grouting behaviour: Application to cyclic thermal loading...217
vii
List of symbols and abbreviations
Latin symbols A coff. cρ Dh d f fatt h I L ṁ Nu n Pr pelectr ppump q qappl qnom R Re Rb r T T0 Tf Tmeasur Tw,entrance Tw,exit Tw,inlet Tw,outlet t
annual oscillation amplitude of temperature (°C) offset factor (°C)
specific heat capacity (J/kgK) hydraulic pipe diameter (m) diameter (m)
Darcy friction factor (-)
attenuation ratio coefficient (°C/m)
convective heat transfer coefficient (W/m²K) applied constant current (A)
length of the heater wire (m) mass flow rate (kg/s)
Nusselt number (-) sample's porosity (-) Prandtl number (-) electric power (W)
power consumed by the pump (W) heat flux per unit length (W/m) applied heating power (W) nominal heating power (W)
total resistance of the heater wire (Ω) Reynolds number (-)
borehole thermal resistance (Km/W) radius (m)
T temperature (°C) or (K) initial temperature (°C) or (K) fluid temperature (°C) or (K) raw measured temperature (°C)
temperature at the entrance of the rig (°C) temperature at the exit of the rig (°C) temperature at the pipe inlet (°C) temperature at the pipe outlet (°C) time (s)
viii Greek symbols α γ λ ρcρ thermal diffusivity (m²/s) Euler's constant (-) thermal conductivity (W/mK) volumetric heat capacity (J/m³K)
Abbreviations BHE COP DTRT DTS FLS GSHP GWHP ICS ILS RTD SEGI TRT
Borehole Heat Exchanger Coefficient of Performance
Distributed Thermal Response Test Distributed Temperature Sensing Finite Line Source
Ground Source Heat Pump Ground Water Heat Pump Infinite Cylindrical Source Infinite Line Source
Resistance Temperature Detector General Service of Informatics Thermal Response Test
1
Chapter 1 - Introduction
Geothermal energy consists in the heat stored in the Earth. Heat is stored by solar radiation and is also continuously generated inside the Earth mainly by the decaying of radioactive isotopes, such us potassium, uranium and thorium, and by the expansion of the Earth's core (latent heat). This heat, as well as the one remaining from the formation of the Earth, flows towards the Earth's surface (Clauser, 2006) (Figure 1.1). Given that this is a continuous process, geothermal energy is classified as a renewable source of energy. The continuous heat flow results in an increase of the temperature inside the Earth with depth. The rate of this temperature increase, the geothermal gradient, reaches an average value of 2.5 °C/km depth close to the surface in stable tectonic areas. At the Earth's surface, manifestations of geothermal energy include volcanic eruptions, geysers, hot springs etc.
Figure 1.1 - Map of Earth's surface heat flux (mWm-2) (Davies and Davies, 2010©)
1.1 Uses of shallow geothermal energy
The potential of geothermal manifestations was exploited in ancient times for cooking, bathing and health care (Kepinska, 2003). In South America, Incas developed bathing facilities close to hot springs areas and used pipes to supply hot and cold water. Balneotherapy (spa treatment) has been practised in Greece, New Zealand, China and Japan.
2 Roman natural and artificial baths (Figure 1.2, left) became the trademark of the roman period, reaching a number of 1.000 in the third century in Rome (Cataldi and Chiellini, 1995). Between the 13th and 16th century, thermal spas became popular all over Europe and the construction of the first geothermal heating district system started in France. In the following centuries, mining industry revealed the geothermal gradient effect on the underground temperature in several locations in Europe and America (Stober and Butcher, 2013). This, in combination with the rapid development of thermodynamics of the 19th century, opened up new horizons on the geothermal energy exploitation. In 1904, the first geothermal power plant was developed in Landerello, Italy, followed by others in New Zealand (1958), Mexico (1959) and USA (1960) (Quick et al., 2010) (Figure 1.2, right). In 1912, the idea of the ground source heat pump was documented in the patent by Heinrich Zoelly, where he proposed the use of a heat pump for extracting heat from the ground. Based on this idea, geothermal energy could be widely utilised for covering energy needs of individual and collective buildings. The first operational installation was recorded in 1940s, in Indianapolis (USA). In Europe, the first horizontal and vertical ground heat exchanger applications were documented in 1970s and 1980s (Sanner, 2001).
Figure 1.2 - Roman baths in Bath, England (left, wikepedia©) and geothermal power plant in Larderello, Italy, ca. 1950 (right, US. National Archives, ThinkGeoEnergy©)
Nowadays, geothermal energy is utilised for electricity production (indirect use) by taking into advantage great temperatures until great depths (a few km, deep geothermal energy). Direct utilisation of geothermal energy includes several applications, such as geothermal heat pumps, space heating, spas, balneology, green house heating and agricultural drying (shallow
3 geothermal energy). Shallow applications also include energy geostructures, where geothermal systems are embedded in concrete elements, such as piles, foundation slabs, retaining walls and tunnels (Brandl, 2006; Laloui and Di Donna, 2013; Barla et al., 2016). According to Lund et al. (2011), the increasing worldwide energy use of direct utilisation applications over the last decades is mainly attributed to the popularity and to the significantly increasing number of geothermal heat pumps installations. The equivalent number of installed units (12 kW) for 2005 was approximately 1.3 million, more than double of the one reported for 2000 (Lund et al., 2005). In a five year period (2005-2010), the corresponding number became 2.7 million with a worldwide installed capacity in the order of 33000 MWt and annual energy use of 20000 TJ/yr.
Shallow geothermal heat pump systems (<400 m depth) exchange heat with the ground either by circulating the groundwater through two separate wells (Ground Water Heat Pumps, GWHPs) or by circulating a fluid in closed pipe loops embedded in the ground mass (Ground Source Heat Pumps, GSHPs) (Preene and Powrie, 2009; Florides and Kalogirou, 2007). In an open-loop system, the extracted water is usually reinjected into the aquifer (Figure 1.3). These systems are quite efficient for large power demands, such as for hospitals, airports or data centers. However, their applicability is limited by the local hydrogeological conditions (groundwater resources and aquifer capacity) and by environmental risks (potential impact on groundwater level, on water quality and on aquatic ecology).
4 Figure 1.3 - Open-loop geothermal heat pump system (after Earthtest Energy©)
Contrary to open-loop systems, closed-loop systems do not require the presence of an aquifer and provide limited environmental risks, mainly associated with the potential leakage of the circulating fluid. There are two main categories of closed-loop systems: horizontal systems and vertical systems. Horizontal systems consist of pipe loops in various configurations (e.g. in series, in parallel, basket-type, "slinky"-type), embedded in the first meters of the ground (Figure 1.4). These systems are suitable for lower power demands such as individual houses and they have a limited capacity (typically required length of 35-60m per kW; Florides and Kalogirou, 2007). Vertical closed-loop geothermal systems, also known as Borehole Heat Exchangers (BHEs), consist typically of one or two U-pipe loops of high-density polyethylene installed in a borehole (Figure 1.5). Other configurations include concentric or coaxial pipes. A grouting material is injected in the borehole to enhance the heat transfer between the circulating fluid and the surrounding ground and to prevent environmental risks (e.g. aquifer contamination). It is also possible that the borehole is filled with groundwater (e.g. in Sweden). These systems are more efficient than horizontal systems, since they take into advantage the annual constant ground temperature at depth. Their capacity varies between 20 W/m - 80 W/m, depending on the ground thermal properties (VDI 4640). They are widely used for heating and cooling of individual and collective buildings (Bayer et al., 2012), since they can be applied in many hydrogeological contexts, are more efficient than horizontal systems and have a small footprint at the ground surface.
5 Figure 1.4 - Horizontal closed-loop geothermal systems (after CREGE©)
6 The geothermal pipes are connected to the heating system through a heat pump, installed inside the building. During operation, heat is transferred from the ground to the circulating fluid and the heat pump increases the fluid temperature at levels suitable for heating purposes. This is achieved by changing the state of the working fluid inside the heat pump (evaporation, compression, condensation and expansion) (Figure 1.6). The procedure is inversed for cooling purposes. The efficiency of the heat pump is expressed by the coefficient of performance (COP), defined as the ratio of the heat delivered by the pump to the (electrical) power required for its operation (Banks, 2009).
Figure 1.6 - Working principle of a heat pump connected to a BHE (Banks, 2009©)
1.2 Benefits and limitations
Compared to other heating systems (air source heat pumps, electric heaters, oil or natural gas boilers), geothermal heat pumps can provide economical and environmental benefits. Although the installation cost is often higher, they have low operating costs and are highly energy efficient in addition to being sustainable. The operating cost consists in the electrical consumption required for the heat pump and the circulation pump operation. The typical COP is 3-5, which means that the delivered energy (heat) is equal to 3-5 times the consumed energy (electricity). This COP is the highest among the different systems, considering that in some of them (e.g. oil or natural gas boilers) more energy is consumed than produced (COP<1). However, geothermal heat pumps, in particular BHEs, have typically higher installation cost than other heating systems (Figure 1.7). This cost consists in the heat pump
7 cost and in the borehole drilling and equipment cost, as well as in a permitting study cost in the case of open-loop systems depending on the policies. The drilling and equipment cost can have a share of more than 50% of the total installation cost (Blum et al, 2011; Buckley et al., 2015). Self et al. (2013) studied the overall cost of different heating systems for several countries in Europe. In most of them, geothermal heat pumps are economically advantageous compared to other heating methods, considering a lifespan of 20 years. The economical benefit depends on the prices for electricity in each country compared to the those of fuels, such as natural gas or oil, and it is increased in the case that the existent geothermal heat pump system is used also for cooling. Moreover, geothermal heat pump installations tend to increase the property value of the building and financial support is provided in several countries for individual or collective installations, such as grants or tax reductions (Jaudin et al., 2013).
Figure 1.7 - Example of installation and annual running cost for different heating solutions (200 m² house in Ireland, annual heating demand of 100 kWh/m²) (Buckley et al., 2015©)
Concerning the environmental benefits, geothermal heat pumps can contribute to the reduction of greenhouse gas emissions and to the counteract of global warming. Geothermal heat pumps do not emit directly CO2, since they do not include burning processes. However,
electricity is required for the operation of the heat pump. The environmental benefits of geothermal heat pumps will vary in each country, depending on the applied technology for electricity production (Rybach, 2010). In the case that electricity is produced by low CO2
emitting power plants, the CO2 emissions related to geothermal heat pumps will be limited.
This makes GSHP installations favourable in countries such as Norway, France, Belgium, Sweden, Austria and Switzerland (Bayer et al., 2012). In the case of high CO2 emitting power
8 will be increased, but it will still remain lower than other heating systems utilising electricity (Self et al., 2013).
Half of EU's annual energy is consumed for the heating and cooling sector (industry, space heating/cooling, agriculture etc.), which is greater than the required energy for transportation or electricity (Figures 1.8 and 1.9). More than 70% of the required energy for the heating and cooling sector is generated by burning fossil fuels (natural gas, coal, oil), while renewable energy applications contribute at only 18%. The EU's energy target is to increase the share of renewable energy at 20% by 2020 and at 27% by 2030. Viable solutions would allow to reduce the CO2 emissions, lower the citizens' expenditures for heating and cooling and reduce
the energy consumption in industry (European Commission - Fact Sheet, 2016). Despite the applicability and the potential of GSHPs, geothermal energy accounts for less than 1.5% of the energy consumption in the heating and cooling sector, with an uneven distribution among the different countries (Table 1.1). Approximately one third of the European GSHPs in 2008 was based in Sweden, where the highest greenhouse gas emission savings were observed. France and Germany follow, with similar numbers of installed units and growth rates. The greenhouse gas emission savings are much higher in France, where nuclear power plants are dominant, compared to Germany, where coal has the highest share on electricity generation. A relatively significant increasing number of installations is also observed in Switzerland, where more than 2000 km of BHEs were drilled only in 2009. In other countries, despite the increasing number of installations, geothermal heat pumps appear to be still at early stage. This is also the case for Belgium, where the CO2 emission factor for electricity is relatively
small (0.37 kg/kWh) and shows, after France and Switzerland, the highest potential on greenhouse gas savings by a wide application of GSHPs (Bayer et al., 2012).
Figure 1.8 - Final energy use in EU-27 by type of energy (left) and for heat by individual sector (right) for 2010 (Sanner et al., 2013©)
9 Figure 1.9 - Share of space heating demand of total heating/cooling demand by country (final energy)
(European Commission- Fact Sheet, 2016©)
10 Factors that prohibit the wide application of these systems include the non-standardized design, the regulative framework and the limited information availability. National standards or guidelines exist only in a few countries in Europe (e.g. Germany, Sweden, France, UK, Switzerland), and the regulative framework can often be non-existent or inappropriate (Jaudin et al., 2013). Another major issue is the high capital cost, especially for BHEs, which can result in long payback periods (typically until 20 years). Moreover, although there are systems operating for more than 30 years, the warranted life span of geothermal heat pumps is limited to 20-25 years (Self et al., 2013). Subsurface characteristics are among the critical parameters for the design and the long-term behaviour of BHEs (MIS 3005; VDI 4640; Luo et al., 2016). Though, in practice, they are often not adequately considered (Blum et al., 2011). This can result in increased capital costs, in the case of oversizing, and to malfunctions or short life spans, in the case of undersizing, overwhelming the potential and the applicability of these systems.
1.3 Literature review
Dehkordi and Schincariol (2014) studied the influence of several factors on the thermal performance of a single-U BHE by numerical modelling. Doubling the ground thermal conductivity can result in an increase in the specific heat extraction rate in the order of 50%, in short-term (6 months) as well as in long-term (25 years). Contrary to the thermal conductivity, the volumetric heat capacity of the ground has a negligible effect on the performance of BHEs. The undisturbed ground temperature influence is critical, since a variation in the average ground temperature of 25% modifies the heat extraction rate by approximately 25%. Kurevija et al. (2014) studied the effect of a high geothermal gradient (55 °C/km) on the design of BHEs, for a case study in Zagreb, Croatia. They concluded that estimating the ground temperature by including the influence of the geothermal gradient can result in a decrease of the required pipe loop length, in the order of 4% - 7% for the different investigated borehole array grids. Therefore, an accurate estimation of the in-situ ground thermal conductivity and of the undisturbed ground temperature is crucial in order to optimise the design and to assure the long-term efficiency of BHEs. The variation of ground thermal conductivity with depth is particularly important, since the detection of highly conductive zones will allow an optimization in terms of the required number and length of
11 BHEs. Moreover, any possible variation of the ground thermal conductivity in space could affect the long-term behaviour of the system, especially in the case of long heating or cooling periods.
1.3.1 Undisturbed ground temperature: in-situ determination and urbanization effect
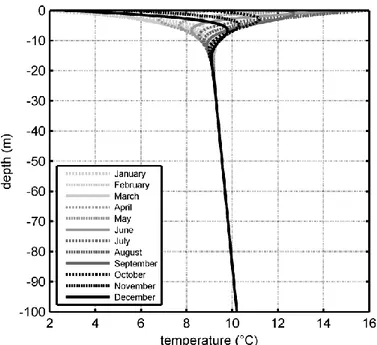
Concerning the undisturbed ground temperature distribution, three zones can be typically distinguished (Popiel et al., 2001). In the surface zone (until ~1 m depth), ground temperature is strongly affected by the weather conditions. In the shallow zone, varying from 1 m to 20 m depth depending on the local ground type, temperature is mainly influenced by the seasonal weather conditions. At the end of this zone, ground temperature is close to the average annual air temperature. The deep zone follows, where temperature is invariant with time and increases with depth according to the local geothermal gradient (Figure 1.10). Deviations from this distribution can be observed in the case of groundwater flow, varying ground thermal properties and/or anthropogenic effects (e.g. construction, agriculture, industry).
Figure 1.10 - Influence of weather conditions and geothermal gradient on the undisturbed ground temperature in Sart-Tilman (Liege, Belgium) based on analytical solution (Tinti, 2012)
12 In urban areas, elevated ground temperatures have been observed worldwide (Zhu et al., 2010; Menberg et al., 2013). They are often characterised by a zero or negative temperature gradient extending to depths more than 50 m (Banks et al., 2009). Several researchers relate this phenomenon to urbanization and other anthropogenic activities (Figure 1.11). For example, Yamano et al. (2009) detected a significant increase of the ground temperature (by up to 1 °C) above a depth of 75 m, based on borehole temperature measurements conducted 3 years before and 6 years after the construction of a museum building in Japan. They related their observation to the ground coverage around the borehole due to the museum building, and/or to the disposal of artificial sediments (6.7 m thick) that modified the ground surface level, sometime between 2 and 11 years before the first measurement. In terms of spatial impact, Liebel et al. (2011) presented temperature profiles of four boreholes which are located in different distances from a school building in Norway. They observed that the ground thermal disturbance decreases proportionally to the increasing distance to the school building. Ferguson and Woodbury (2007) conducted a spatiotemporal survey with repeated temperature measurements in a period of 7 years, in wells in the area of Winnipeg, Canada. In one well, 3 m away from a building reoccupied in the last 20 years, they observed a warming trend in the subsurface. In another well, located in an area covered with grass, a cooling trend was observed, mainly attributed to the demolition of buildings in the area during this period.
13 In these studies, elevated temperatures and negative temperature gradients are attributed to the urbanisation effect mainly based on observations of buildings presence and occupation close to the measurement locations. However, to the author's knowledge, this has not been further validated, for example with numerical modelling. This would also allow to provide an indication of the temperature field evolution with time in the surrounding ground and to study its effect on the design of BHEs (section 1.4).
The undisturbed ground temperature is determined in-situ by mainly two methods (Spitler and Gehlin, 2015). The first method consists in temperature logging along the borehole, usually by lowering down a temperature probe inside the U-pipe and measuring the temperature at several depth intervals. The second method consists in circulating the fluid inside the pipe loops without heat injection and recording the temperature at the pipe inlet and outlet. Both methods assume that a thermal equilibrium has been reached between the fluid inside the pipes and the ground and they estimate the mean ground temperature over the depth of the BHE by averaging the measured data. The accuracy of the first method (borehole logging) depends on the accuracy of the measurement equipment and on the chosen depth interval. It is recommended to lower down the temperature sensor slowly, to prevent as possible any disturbance of the water, and to apply sufficiently small depth intervals, in order to capture the possible variations of the ground temperature with depth. The latter could allow to detect any deviations from the typical undisturbed ground temperature distribution. The ground temperature profile can also be obtained by installing temperature sensors or fiber optic cables along the borehole. The second method (during fluid circulation) is widely applied, since it consists in the preliminary phase of a Thermal Response Test (TRT), as described later in this section, and has a typical duration of 2 h - 12 h (Loveridge et al., 2013). Though, apart from the measurement equipment accuracy, the estimated mean ground temperature by this method can be affected by the heat added to the circulating fluid due to friction and the pump work, as well as by the possible thermal interaction between the circulating fluid and the ambient air.
Gehlin and Nordell (2003) compared the two above methods in a single-U BHE of 58 m long, filled with groundwater in a hard crystalline rock in Sweden. First, they lowered down a temperature sensor inside the borehole and measured the temperature at intervals (every 1 m for the first 10 m and every 2 m for the rest). Then, they circulated a water/glycol mixture
14 inside the pipe loop for 77 min. For the first few minutes of circulation, the recorded temperature was in good agreement with the one of the borehole logging (within 0.1 °C). After about 15 minutes of circulation, a constantly increasing temperature was recorded, resulting in an overestimation of the ground temperature (of 0.4 °C after 30 min and of 2 °C after 60 min). They attributed it, for their case study, to the heat added to the system by the pump work itself. Moreover they suggested that taking the minimum recorded temperature for the estimation of the initial ground temperature (Kavanaugh et al., 2001) could lead in strongly underestimated temperature in case of low ambient temperatures during the test. Loveridge et al. (2013) measured the undisturbed ground temperature in a 150 m deep BHE in London Basin. They obtained the ground temperature profile by fourteen thermistors attached along the U-loop and by lowering a thermistor string at 5 m intervals into the pipe loop. Both data sets showed the same trend, with a greater scatter in the installed thermistors measurements. They also estimated the mean ground temperature by fluid circulation in the pipe loops for 15 h. The mean temperature by the thermistor string (13.4 °C) was in between the range of the recorded fluid temperature during circulation (13.3 °C - 13.5 °C). Acuña et al. (2009) presented measurements in a BHE in Sweden, of about 260 m long, where a fiber optic cable was located inside the U-pipe. They determined the undisturbed temperature from the optical fiber measurements, with a measurement length interval of 10 m, before and after 24 hours of fluid circulation. They observed an increase of the average temperature of 0.09 °C during the fluid circulation and they mainly attributed it to the circulation pump work.
These studies mainly focus on the effect of the pump work on the accuracy of the undisturbed ground temperature estimation. Another important factor is the insufficient equipment insulation, since it can result in oscillations in the recorded temperature evolution, as it is widely illustrated in the heating phase temperature measurements. It would therefore be interesting to investigate if the thermal interaction between the circulating fluid and the ambient air can result in a significant error on the undisturbed ground temperature estimation that has an important effect on the design (section 1.4).
15
1.3.2 Thermal Response Test and interpretation by the Infinite Line Source model
The in-situ ground thermal conductivity, as well as borehole thermal resistance, are usually obtained by conducting a Thermal Response Test (TRT). Spitler and Gehlin (2015) presented a review on the development of the test equipment, the test procedure and the different interpretation analyses. The typical equipment for a TRT (Gehlin, 2002) consists of a pump (to circulate the fluid inside the pipes), an electric resistance heater (to inject constant heat), temperature sensors (to measure the temperature) and a data logger (to record the measurements during the test). The equipment is connected to the BHE pipes and insulation layers are attached around the pipes to minimize the heat transfer between the circulating fluid and the air (Figure 1.12). Before starting the test, water is circulated at high flow rate to purge air from the system. After purging the air, the first phase of the test starts. During this phase, water is circulated inside the pipe loop to achieve equilibrium between the water and the surrounding ground and to obtain the undisturbed ground temperature. The second phase consists of a continuous water circulation with usually constant heat input. After the heating period, the system is left to recover. During the test, temperature is recorded at the pipe inlet and outlet. Based on the measured data, the mean thermal conductivity of the surrounding ground and the mean borehole thermal resistance can be calculated.
Figure 1.12 - Pipe insulation procedure and TRT equipment
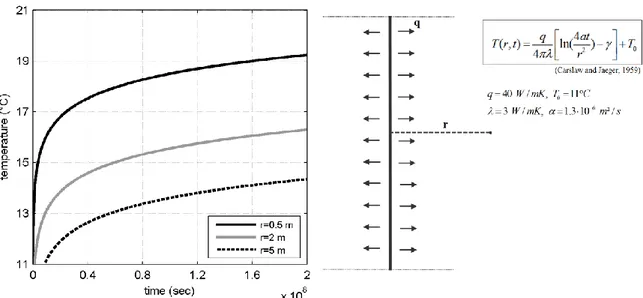
The measured data are widely analysed by applying the simple, analytical solution of the Infinite Line Source (ILS) model. This model describes the heat propagation in an infinite homogeneous medium subjected to a infinite line source embedded along the vertical axis. The line source injects constant heat continuously since time zero and heat flows by conduction in the surrounding medium in the radial direction. Carslaw and Jaeger (1959)
16 gave a simplified form of the line source solution for the temperature at time t and at distance r from the line source (Figure 1.13):
0 2 4 ( , ) ln( ) 4 q at T r t T r ,
where q: the heat flux per unit length produced by the infinite line source (W/m), λ: the thermal conductivity of the medium (W/mK),
α: the thermal diffusivity of the medium (m²/s), γ≈0.5772 is Euler's constant and
T0: the initial temperature of the medium (K).
Figure 1.13 - Temperature evolution at certain distances from the line source (simplified ILS solution; Carslaw and Jaeger, 1959)
This simplified expression is valid for steady-state heat transfer conditions within the radius r and results, due to the mathematical simplifications, to a maximum error of 2% for
t r/ ²5 (Hellström, 1991). To apply this solution to BHEs, Mogensen (1983) introduced the borehole thermal resistance, Rb, and considered the mean fluid temperature, Tf, as the mean of the pipeinlet and outlet temperature. By using the simplified line source solution the mean fluid temperature Tf (TinletToutlet) / 2 can be described as (Wagner and Clauser, 2005):
17 0 2 4 ln( ) ln +T 4 4 f b b q q T t qR r
,where rb: the borehole radius (m).
In this expression, the mean fluid temperature evolution is a line in a semi-log scale, ln( )
f
T a t b (Figure 1.14). The mean thermal conductivity and the mean borehole thermal resistance can be calculated from the slope a and the constant b, respectively. It should be noted that the results from this approach correspond to the mean values of the effective ground thermal conductivity and borehole thermal resistance. The effective ground thermal conductivity includes possible effects of heterogeneity, of groundwater flow and of the initial ground temperature field in combination with the applied mode (heating/cooling). Factors that influence the effective borehole thermal resistance include the borehole diameter, the grouting properties and the pipe loop position at the borehole cross section, as well as the applied flow rate and the pipe legs interaction.
18 The simplified ILS solution is valid for steady-state heat transfer condition inside the borehole, which is generally achieved after 1 h -12 h of operation for normal borehole sizes and ground conditions (Spitler and Gehlin, 2015). Before reaching the steady-state, the fluid temperature evolution is dominated by the borehole filling properties and, therefore, the corresponding data should not be included in the linear interpolation of the TRT data. This solution also requires that sufficient time has elapsed for the mathematical simplifications to be valid. It is proposed for t r/ ²b 5 /, indicating that the results are inaccurate for small distances from the borehole center and/or for short time periods. Moreover, the ground is considered as an homogenous and isotropic medium with uniform initial temperature field. Other assumptions of the ILS model are the simulation of the BHE as an infinite long line and that the temperature distribution is radial, which indicate that the thermal effects at the ends of the borehole are negligible. Philippe et al. (2009) compared the ILS model with the Infinite Cylindrical Source (ICS) model, where the heat transfer rate is imposed at the borehole wall instead of its center, and the Finite Line Source (FLS) model, which can include the thermal effects at the ends of the borehole (Figure 1.15). For a typical borehole radius of 0.05 m, they calculated a difference between the ILS and ICS results of less than 10% after 10 h of operation, decreasing to 1% after 2.6 days. The thermal effects at the borehole ends become important after several years of constant heat transfer rate and for short BHEs. For example, the calculated borehole wall temperature by the ILS model was found overestimated of 5% after 6 years for a 50 m long BHE and after 30 years for a 100 m long BHE (α=0.53 10-6
m²/s). They concluded that, for typical operational conditions, the maximum error in the borehole wall temperature based on the ILS model is 5% for time limits between 13 h to 18 years. In practice, the typical duration of the TRT is 50 h - 60 h, with proposed values in literature varying from 12 h to 60 h (Singorelli et al., 2007; Rainieri et al., 2011; Spitler and Gehlin, 2015). Considering the typical duration of the TRT and the results presented previously by Phillipe et al. (2009), the error of the ILS model interpretation associated with ends effect and the BHE dimensions will be limited. Singorelli et al. (2007) conducted numerically TRTs and analysed the results by applying the ILS model. They studied, among others, the effects of the test duration and of the ground heterogeneity, by comparing the analytically obtained thermal conductivity with the one assigned to the numerical model. For the investigated heterogeneous cases, the obtained thermal conductivity values were lower than the one of the homogenous case, with small differences for the different operation modes (heating/cooling). Though, all the cases (homogeneous and
19 heterogeneous) resulted in an error less than 10%, for conduction dominated heat transfer. They proposed that a test duration of 50 h can provide a satisfactory estimation of the ground thermal conductivity, in the case that groundwater effects are not dominant.
Figure 1.15 - Relative difference in borehole wall temperature between the Infinite Cylindrical Source (ICS), the Finite Line Source (FLS) and the Infinite Line Source (ILS) solution for typical operating
conditions (Philippe et al., 2009©)
A constant heat input is a critical requirement for the application of the ILS model interpretation. In practise, variations in the applied heat input are attributed to voltage variations in the supplied electricity and/or to insufficient insulation of the test equipment, that allows a thermal interaction between the circulating fluid and the ambient air. This results in oscillations of the recorded fluid temperature profiles, that can affect the accuracy of the ILS results. Singorelli et al. (2007) interpreted the data of an in-situ TRT of a varying heat input. They estimated the ground thermal conductivity numerically, including the variations of the heat input, and observed that there was a correlation between the variations in the estimated thermal conductivity and the ambient air temperature variations. The average estimated thermal conductivity was equal to the one measured at the laboratory. Though, the ILS interpretation, by evaluating 24 h data windows and by assuming the 24 h average power
20 supply, resulted in varying thermal conductivity with time, with an average value significantly lower (approximately of 15%) than the one estimated numerically. They concluded that there was not a clear definition on the choice of the part of the measured data to be evaluated, that would allow to improve the accuracy of the ILS results. Witte et al. (2002) conducted TRTs by fixing the temperature difference between the pipe inlet and outlet. This allowed to avoid heat input fluctuations due to unstable power supply. They showed that even a small influence of the ambient air on the fluid temperature (variation of ±0.15 °C) can have an important influence on the estimated thermal conductivity. They proposed that enhancing the insulation of the test equipment and controlling the temperature difference inside the borehole could limit the effect of the air-fluid interaction. Choi and Ooka (2016a) developed a quasi-steady analytical model, which takes into account insulation characteristics and the effect of various weather conditions. To limit the ambient air interaction effect, they recommended an insulation layer of more than 10 mm and retaining the connecting pipes as short as possible. Moreover, they showed that radiation effects can contribute significantly to temperature oscillations and recommended bright, reflecting materials for the insulation and the test equipment. In their study (Choi and Ooka, 2016b), they analysed statistically 36 numerical TRTs influenced by various weather conditions, interpreted by the ILS model. They recommended a minimum test duration of 60 h, to retain the ILS results error lower than 5%. They also proposed that the simplified ILS model interpretation should be avoided, in the case of short TRT duration combined with important radiation effects during the first day of the test.
The importance of the test rig insulation during the heating phase of the TRT is highlighted in these studies, since thermal interaction with the ambient air can result in varying heat input. The duration of the TRT seems to be critical in this case, where temperature oscillations can affect the linear slope sensitivity of the ILS interpretation. Experimental studies in literature are limited to TRTs of a few days and the recommended minimum duration for the TRTs reaches 60 h. The question arises if a longer duration, of several days or even weeks, could significantly improve the accuracy of the results when the ILS model is applied. Moreover, in the case of the typical applied duration (50 h - 60 h), which part of the measured data set should be chosen for the ILS interpretation in order to minimize the influence of the temperature oscillations and to improve the accuracy of the results? Furthermore, the results of the typical duration TRTs might not be representative of the in-situ conditions during the
21 operation of the system (e.g. for longer heating periods or during the recovery phases, where the heat flow direction is inversed). This is observed in the case that ground water effects are dominant and the TRT interpretation can not provide a unique value for the effective thermal conductivity (Loveridge et al., 2013). It would be interesting to investigate if in the case that groundwater effects are not dominant, the TRT results can be representative of the BHE behaviour for longer heating periods and different modes (heating/recovery) (section 1.4).
1.3.3 Variation of ground thermal properties
At the laboratory scale, several studies include measurement at soil and rock samples, core samples or cuttings to investigate the influence of various factors (e.g. mineral composition, porosity and degree of saturation) on the thermal properties (Clauser and Huenges, 1995; Popov et al., 1999; Pechnig et al., 2010). Moreover, in the case that the rock sample consists of foliations (e.g. shale samples), an anisotropic thermal behaviour is observed depending on the direction of the heat flow with regard to the foliations orientation. The thermal conductivity parallel to the foliations can be up to 2.5 times higher than the one perpendicular to the foliations (Popov et al., 1999; Eppelbaum et al., 2014). These effects are widely studied at the laboratory scale, however, extrapolating laboratory results to in-situ conditions remains challenging (Liebel et al., 2010; Luo et al., 2016). In situ, any possible deviation from the samples characteristics (e.g. degree of saturation, fracturing, porosity), as well as groundwater flow can result in a different effective ground thermal conductivity than the one measured at the laboratory. Moreover, the in-situ ground thermal behaviour will be affected by the in-situ undisturbed temperature field (geothermal gradient effect, urbanisation effect, air variations influence at the top ground meters), an influence that is not included in the laboratory measured thermal conductivity values.
TRTs allow to estimate the effective ground thermal conductivity including the influence of the in-situ conditions. However, the estimated value corresponds to the mean thermal conductivity of the ground surrounding the borehole. The detection of a varying thermal conductivity with depth is particularly important, since the detection of highly conductive zones will allow an optimization in terms of the required number and length of BHEs. Temperature borehole logging during and after a TRT can significantly contribute to this end.
22
1.3.3.1 Distributed Thermal Response Test
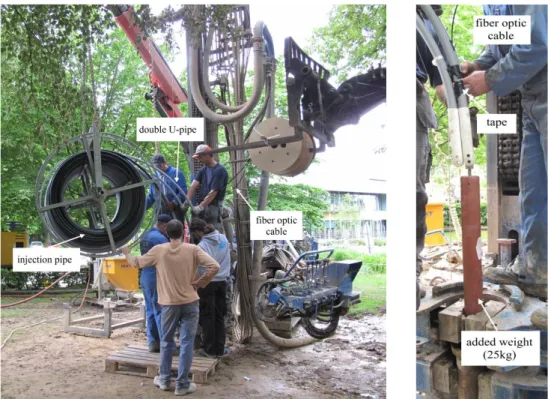
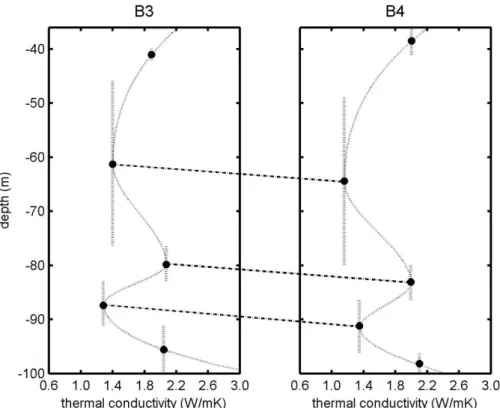
During a Distributed Thermal Response Test (DTRT), temperature is measured not only at the pipe inlet and outlet but also at different depths along the borehole, by temperature sensors or fiber optic cables installed inside the borehole (Figure 1.16). Fujii et al. (2006) instrumented two BHEs of 50 m long, installed at a distance of 5 m from each other, in a heterogeneous deposit in Japan (sand, silt and gravel followed by siltstone and sandstone layers). In the coaxial BHE, a fiber optic cable was fixed at the outer surface of the outer pipe, while in the double-U BHE a cable was fixed at the center of the U-pipes. The distribution of the calculated ground thermal conductivity (interval of 1 m) agreed with the local hydrogeological information and some difference were found between the results for both BHEs at certain zones. Florides et Kalogirou (2008) studied a U-pipe BHE of 50 m long, crossing sandstone and marl layers in Cyprus. They installed 20 thermocouples at various depths in the grout and they detected, based on the recorded temperature profiles, layers with higher heat transfer rate. Acuña et al. (2009) conducted a DTRT in a U-pipe BHE, of about 260 m long, in Sweden. They inserted a fiber optic cable inside the U-pipe and obtained fluid temperature measurements with a length interval of 10 m. They divided the borehole into 12 sections, of 20 m each, and they observed variations in the supplied power during the test with depth and with time. A varying ground thermal conductivity through depth (2.60 W/mK - 3.62 W/mK) was calculated, with almost no deviation between the depth-average value and the one resulting from the conventional TRT procedure. Soldo et al. (2016) presented fiber optic measurements in a 100 m long, double-U BHE in an heterogeneous ground in Croatia (gravel, sand, clay, silt and coal layers). The fiber optic cable was inserted inside one of the U-pipes and the measurement interval was 2 m. They found different thermal conductivity values for the 8 layers, varying from 1.52 W/mK to 2.36 W/mK. Direct thermal measurements (mainly core samples) underestimated the thermal conductivity in most layers (up to 0.78 W/mK), which they mainly attributed to scale and water content problems of the core measurements.
23
Figure 1.16 - Installation of fiber optic cables at the outer surface of U-pipes (Bassenge, Belgium)
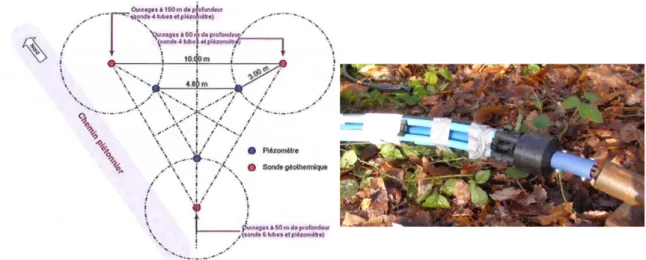
The experimental site of BRGM (Bureau de Recherches Géologiques et Minières, Orléans, France) includes several installed shallow geothermal systems (horizontal, double U-pipe, "basket-type" etc.), in order to compare the different applications and to investigate the influence of several parameters on their behaviour (Philippe, 2010). Concerning the BHE configurations, this site includes two double-U BHEs, of 50 m and 100 m long, and a 5-tube coaxial BHE of 50 m long. The three BHEs and three piezometric boreholes located in between them were equipped with fiber optics (Figure 1.17). Among others, a 100 h-duration TRT was conducted in the double-U pipe of 100 m long and the temperature along its length was measured by the fiber optics (Chalhoub et al., 2014).
Figure 1.17 - Relative position of the BHEs and the piezometric boreholes (left, Chalhoub et al., 2014©) and coaxial pipe equipped with fiber optic cable (right, Philippe, 2010©) in the experimental
24 DTRTs allow to investigate any possible variations of the effective ground thermal conductivity with depth by taking into account the in-situ conditions. The experimental studies presented above concern DTRTs of a few days and measurements at the borehole scale. However, due to their limited duration, the BHE behaviour might not be representative of the in-situ conditions during the operation of the system (e.g. for longer heating periods or during the recovery phases, where the heat flow direction is inversed). A long-duration DTRT would allow to detect any possible variation of the effective thermal conductivity while the temperature field evolves in the surrounding ground. In this context, it would be interesting also to monitor the temperature evolution in the surrounding ground that could provide indications on the effect of the subsurface characteristics in the evolving thermal plume (section 1.4).
1.3.3.2 Recovery profiles analysis
The study of recovery profiles can also provide information on the variability of the ground thermal properties. Loveridge et al. (2013) calculated the thermal conductivity during the heating and the recovery phase based on temperature measurements by thermistors, attached along the U-loop in the 150 m deep BHE in London Basin. The results were consistent with the Chalk aquifer characteristics, where major fractures dominate the groundwater flow. Fujii et al. (2009) used optical fiber sensors to record vertical temperature profiles in two bedrock case-studies in Japan and related these results with local geological and groundwater information, to verify the validity of the test and interpretation method. In the first case a permeable granite zone of 10 m thick was related to higher calculated thermal conductivity and quicker temperature recovery compared to non-permeable granite, as an effect of an active groundwater flow. In the second case lower thermal conductivity was related to weathered tuff, compared to unweathered tuff. Liebel et al. (2011) studied non-grouted wells in Norway and proposed taking temperature measurements four to five hours after the beginning of the recovery phase. They related faster temperature recovery to hydraulically active fractures and upcoming groundwater flow from confined artesian aquifers, as an effect of groundwater flow. They verified the existence of fractures by using flow measurement test data, televiewer imaging and/or drillers reports.
25 The study of recovery profiles allows the detection of layers of high heat transfer rate and contribute to the optimum design of BHEs. The recovery profiles correlations provided in literature mainly concern distinct thick layers and/or are based on groundwater flow effects. The question arises if recovery profiles can provide information in the case that groundwater effects are not dominant and to which extent thin layers can be detected. Moreover, hardening of the grouting material is an exothermic process, during which heat is generated. The temperature evolution along BHEs during this process has not been monitored in-situ, according to the author's knowledge. It would be interesting to investigate if borehole logging during hardening of the grouting material can contribute to the subsurface heterogeneity characterisation (section 1.4).
1.4 Objectives of the thesis
The EU's energy target is to increase the share of renewable energy at 20% by 2020 and at 30% by 2050. Viable solutions would allow to reduce the CO2 emissions, lower the citizens'
expenditures for heating and cooling and reduce the energy consumption in industry. BHEs can significantly contribute to this end due to their high applicability and their economical and environmental benefits. They can be applied in many hydrogeological contexts, are more efficient than horizontal geothermal systems and have a small footprint at the ground surface. Moreover, they have low operating costs, limited CO2 emissions related to their operation and are highly
energy efficient.
However, geothermal energy applications accounts for less than 1.5% of the energy consumption in the heating and cooling sector in Europe and in most of the countries they appear to be still at early stage. Factors that prohibit the wide application of these systems include the non-standardized design, the regulative framework and the limited information availability, and in particular the high capital cost, especially for BHEs, which can result in long payback periods (typically until 20 years). Moreover, although there are systems operating for more than 30 years, the warranted life span of geothermal heat pumps is limited to 20-25 years. There is therefore the need to optimise the design and assure the long-term behaviour of these systems. A controlling factor is the subsurface characteristics, which in practice are often not adequately considered. This can result in increased capital costs or to malfunctions and short life spans, overwhelming the potential and the applicability of these systems.
26 This thesis focuses on the influence of the in-situ characteristics on the design and the behaviour of BHEs, at the borehole scale and its surroundings, based on an in-situ case study of an heterogeneous bedrock in a semi-urban environment. In a local scale, this thesis puts in evidence the potential of BHEs in a geological context typical of the Walloon region, Belgium, where these applications are still at early stage and there is a great potential on greenhouse gas savings by their wide application. In this thesis, the following topics are studied:
1. A first objective is to provide an estimation of the temperature field evolution with time in
the surrounding ground in semi-urban areas and investigate its influence on the design of BHEs. This is also of interest for the long-term behaviour of BHE systems, given that the heat loss through structures into the subsurface is a continuous phenomenon, that recharges the geothermal reservoir potential (Chapter 4).
2. Given that the undisturbed ground temperature is widely estimated during the first phase of
a TRT (fluid circulation in the pipe loops), it is investigated if the thermal interaction between the circulating fluid and the ambient air can result in a significant error that has an important effect on the design (Chapter 4).
3. Another objective is to investigate the effect of heat input oscillations during a TRT on the
sensitivity of the ILS interpretation results. In particular, it is studied if a test duration, longer than the typical one (50 h - 60 h), of several days or even weeks could significantly improve the accuracy of the results when the ILS model is applied. Moreover, in the case of the typical applied duration, it is of interest to provide recommendations on which part of the measured data set should be chosen for the ILS interpretation in order to minimize the influence of the temperature oscillations and to improve the accuracy of the results (Chapter 5).
4. Obtaining the recovery temperature profiles can allow the detection of layers of high heat
transfer rate and contribute to the optimum design of BHEs. The objective is to investigate ifrecovery profiles can provide information in the case that groundwater effects are not dominant and to which extent thin layers can be detected (Chapters 5 and 6). Moreover, it is
27 of interest to study the contribution of temperature borehole logging during hardening of the grouting material to the subsurface heterogeneity characterisation (Chapter 5).
5. The thermal behaviour of the BHE during operation and the thermal plume in the
surrounding ground can be predicted based on the TRT data analysis, considering the ground an homogenous, isotropic material. However, this assumption is not always valid and the estimated effective thermal conductivity might not be representative of the in-situ conditions for longer heating periods or during the recovery phases, where the heat flow direction is inversed (e.g. in the case that groundwater effects are dominant). The last objective consists in investigating if the TRT results could be representative of the BHE behaviour for longer heating periods and different modes (heating/recovery), in the case that groundwater effects are not dominant, and in studying the influence of in-situ characteristics (heterogeneity and anisotropic effects, ambient air temperature variation effect, thermal effects at the borehole end) on the temperature field evolution in the surrounding ground (Chapter 6).
1.5 Outline of the thesis
This thesis provides some insight on the above presented topics, based on an in-situ study of four double-U BHEs, of about 100 m long, installed in an heterogeneous bedrock on the campus of the University of Liege (Liege, Belgium). The BHEs were installed over a surface area of 32 m² and equipped with fiber optic cables along the outer surface of the pipe loops. Fiber optics allowed to obtain continuous, high-resolution temperature profiles along the pipe loops. A detailed bedrock characterisation was achieved based on borehole televiewer measurements in the four boreholes, in this geological context typical of the Walloon region (Belgium). Several temperature measurements were conducted in a period of four years: during hardening of the grouting material, at the undisturbed state and during the heating and the recovery phase of DTRTs of a duration of 7 days. Moreover, a long-duration DTRT (heating phase of 7 months) was conducted in one of the BHEs. During this test, temperature was measured by the fiber optics during the heating and the recovery phase in all the four BHEs. These measurements create a unique data set, that allows to investigate the BHE behaviour for longer heating periods and to investigate the effect of various factors on the thermal plume in the heterogeneous bedrock at the in-situ scale. The measurements of the undisturbed temperature revealed the effect of heat loss through structures into the subsurface
28 in this semi-urban environment. The influence of the insufficient insulation of the test rig equipment was observed in all the in-situ DTRTs. The temperature measurements during the long-duration DTRT allowed to investigated the influence of the test duration on the ILS interpretation and the effect of in-situ characteristics (e.g. heterogeneity, anisotropic thermal behaviour, ambient air temperature variations) on the thermal plume in the rock mass.
The remainder of the thesis is organised as follows:
Chapter 2 describes the site installation procedure and the geological interpretation based on
the borehole televiewer measurements and cuttings observation. It also includes the cuttings thermal conductivity measurements at the laboratory and a discussion on their interpolation to the in-situ conditions.
Chapter 3 concerns the fiber optic measurements principle. It focuses on the accuracy of the
fiber optic measurements and highlights the importance of a continuous offset calibration.
Chapter 4 focuses on the determination of the undisturbed ground temperature. Different
experimental approaches are compared: borehole logging (by fiber optics and by lowering a temperature sensor inside the pipe loop) and during water circulation in the pipe loops. In the latter, the effect of the insufficient test rig insulation is thoroughly studied. This chapter also includes an analytical estimation of the undisturbed ground temperature for the Sart-Tilman area, as well as a 3D numerical model which takes into account the heat loss through existing structures into the subsurface. The numerical results are compared to the in-situ measurements and the effect of urbanization and of the insufficient test rig insulation on the design is discussed.
Chapter 5 presents the temperature measurements during the in-situ DTRTs in the four
BHEs, as well as 3D numerical modelling of the in-situ tests. Based on the experimental data, the heat input oscillations effect on the ILS model analysis is studied and the contribution of a long duration TRT is investigated. The fiber optic measurements during the heating phase are studied, in combination with the numerical results, and a correlation of the recovery profiles with the gamma-ray measurements is provided. Moreover, fiber optic measurements during hardening of the grouting material are presented and correlated with fractured zones in the