1
J. Dairy Sci. 100:1–12
https://doi.org/10.3168/jds.2017-12720 © American Dairy Science Association®, 2017.
ABSTRACT
An increasing number of models are being developed to provide information from milk Fourier transform mid-infrared (FT-MIR) spectra on fine milk composi-tion, technological properties of milk, or even cows’ physiological status. In this context, and to take ad-vantage of these existing models, the purpose of this work was to evaluate whether a spectral standardiza-tion method can enable the use of multiple equastandardiza-tions within a network of different FT-MIR spectrometers. The piecewise direct standardization method was used, matching “slave” instruments to a common reference, the “master.” The effect of standardization on network reproducibility was assessed on 66 instruments from 3 different brands by comparing the spectral variability of the slaves and the master with and without stan-dardization. With standardization, the global Maha-lanobis distance from the slave spectra to the master spectra was reduced on average from 2,655.9 to 14.3, representing a significant reduction of noninformative spectral variability. The transfer of models from instru-ment to instruinstru-ment was tested using 3 FT-MIR models predicting (1) the quantity of daily methane emitted by dairy cows, (2) the concentration of polyunsaturated fatty acids in milk, and (3) the fresh cheese yield. The differences, in terms of root mean squared error, be-tween master predictions and slave predictions were reduced after standardization on average from 103 to 17 g/d, from 0.0315 to 0.0045 g/100 mL of milk, and from 2.55 to 0.49 g of curd/100 g of milk, respectively. For all the models, standard deviations of predictions among all the instruments were also reduced by 5.11 times for methane, 5.01 times for polyunsaturated fatty acids, and 7.05 times for fresh cheese yield, showing an improvement of prediction reproducibility within
the network. Regarding the results obtained, spectral standardization allows the transfer and use of multiple models on all instruments as well as the improvement of spectral and prediction reproducibility within the network. The method makes the models universal, thereby offering opportunities for data exchange and the creation and use of common robust models at an international level to provide more information to the dairy sector from direct analysis of milk.
Key words: Fourier transform mid-infrared spectra,
standardization, milk, model transfer
INTRODUCTION
Over the past decade, the number of research stud-ies seeking to extract more quantitative information from the Fourier transform mid-infrared (FT-MIR) spectra has increased constantly (De Marchi et al., 2014). Equations based on the full spectrum have been developed for the determination of fine milk compo-nents such as fatty acid profiles (Soyeurt et al., 2006; Rutten et al., 2009), protein composition (Bonfatti et al., 2011), minerals (Soyeurt et al., 2009), ketone bodies (van Knegsel et al., 2010), citrate (Grelet et al., 2016), and lactoferrin (Soyeurt et al., 2007). Other studies have focused on FT-MIR spectra to build equations predicting technological properties of milk such as milk acidity (De Marchi et al., 2009), ability to coagulate, firmness of curd, or cheese yield (Dal Zotto et al., 2008; Colinet et al., 2015). Recent work has directly consid-ered the FT-MIR spectrum of milk as a reflection of cows’ status, with FT-MIR equations being developed to predict methane emissions of dairy cows (Dehareng et al., 2012; Vanlierde et al., 2016), likelihood of con-ception (Hempstalk et al., 2015), body energy status (McParland et al., 2011), energy intake and efficiency (McParland et al., 2014). In the work of Lainé et al. (2017), the spectrum is even considered as a response for which the effect of pregnancy is evaluated. Hence, the FT-MIR analysis of milk allows the measurement
Standardization of milk mid-infrared spectrometers
for the transfer and use of multiple models
C. Grelet,* J. A. Fernández Pierna,* P. Dardenne,* H. Soyeurt,† A. Vanlierde,* F. Colinet,† C. Bastin,‡ N. Gengler,† V. Baeten,* and F. Dehareng*1
*Valorization of Agricultural Products Department, Walloon Agricultural Research Center, 5030 Gembloux, Belgium
†Agriculture, Bio-Engineering, and Chemistry Department, University of Liège, Gembloux Agro-Bio Tech, 5030 Gembloux, Belgium ‡Walloon Breeding Association, B-5590 Ciney, Belgium
Received February 13, 2017. Accepted June 5, 2017.
of multiple variables to be used for fine milk quality control in industry, management of herds, or the gen-eration of new phenotypes for genetic studies. Even if some models could be statistically considered as low quality, they are of major interest for the dairy sector because they provide the opportunity to predict key variables that were not available before on a large scale and in a cost-effective way.
However, developing such models is time consuming and expensive given that they require the analysis of a large number of samples to cover the whole distribution of the studied trait as well as a large spectral vari-ability. Therefore, there is a clear interest in sharing predictive models among milk laboratories and milk recording organizations. However, a major issue with FT-MIR data is related to the specific instrumental response produced by each spectrometer. These differ-ences between spectral responses of instruments origi-nate from the physical characteristics and acquisition modes specific to each model of machine and from the different uses, piece replacements, and maintenance operations specific to each spectrometer. Differences in spectral response cause difficulties in combining spec-tra as well as bias in predictions when spec-transferring a calibration model built on one instrument to another instrument. Consequently, exchanges of data and mod-els are limited. To cope with this issue, classical modmod-els predicting the main milk components by FT-MIR (e.g., fat and proteins) are monitored and adjusted over in-struments and over time using slope and intercept cor-rection. The method is based on the adjustment of the models according to interlaboratory study samples, in which the content of the relevant components is known. However, for most of the new predicted variables (e.g., cows’ physiological status or hard-to-measure fine milk components), it is expensive or almost impossible to produce interlaboratory study samples with a known content of the variable of interest. This makes it dif-ficult or impossible to adjust a model after transfer to another spectrometer. Consequently, a model devel-oped on one instrument theoretically can be used only by that instrument because of its specific format. In the context of increasing interest in using new models, the impossibility of transferring them leads to a suboptimal situation, as the creation of robust models is difficult and expensive.
For this reason, it is necessary to implement a pre-liminary step of spectral standardization permitting the sharing of models. In the context of projects in-volving international networking, since December 2011 a large instrument standardization network has been developed to harmonize the format of FT-MIR milk spectral response. The objective is to clear the way for potential collaborations between organizations using
FT-MIR spectrometers for milk analysis. The possibil-ity of creating common data sets and common models that can be transferred from laboratory to laboratory and used by all instruments allows financial and techni-cal resources to be pooled. Moreover, the possibility of merging spectral data, as far as the reference methods are comparable, allows the inclusion of different feed-ing systems, breeds, and management, thus increas-ing the robustness of the developed common models. Over the years the network size has increased, and as many as 127 instruments of 3 different brands com-ing from 14 countries on 4 continents (North America, Asia, Europe, and Oceania) have been standardized. Recently, it has been shown that using the piecewise direct standardization (PDS) method it is possible to transfer a high-quality fat model from one instrument to more than 20 different instruments in the network (Grelet et al., 2015). However, there is no information about the possibility of transferring models with lower accuracy or predicting fine milk composition or indirect variables, which are not milk components and conse-quently are predicted indirectly, despite the fact that these models are of great interest to the dairy sector. Furthermore, the effects of standardization on spec-tral and prediction reproducibility over the network have never been assessed even though it is essential for management or breeding purposes. Therefore, the objectives of this study were to evaluate the effect of the PDS standardization method (1) on spectral re-producibility over spectrometers in a network, (2) on transferring multiple and varied FT-MIR models from one instrument to another, and (3) on the accuracy and reproducibility of predictions among all apparatus. The global perspective is to make all spectrometers speak the same language, thereby allowing the transfer and exchange of developed models predicting classical and new parameters throughout the network.
MATERIALS AND METHODS Instrumentation
The different instruments available through the network are FT 6000, FT+, FT2, and FT120 (Foss, Hillerød, Denmark); FTS (Bentley, Chaska, MN); and Standard Lactoscope FT-MIR automatic (Delta Instru-ments, Drachten, the Netherlands). The wave number ranges of the different brands were 925.66 to 5,010.15 cm−1 for Foss instruments, 649.03 to 3,998.59 cm−1
for Bentley instruments, and 397.31 to 4,000 cm−1 for
Delta instruments. The resolution used was 8 cm−1 for
Delta and Bentley instruments and unknown for Foss instruments. As the goal of this work was to validate the standardization method rather than to compare
the results of the different brands, the brands were anonymized as brand A, brand B, and brand C. In this study we used data coming from a December 2015 interlaboratory study involving 66 instruments of the 3 brands located in 26 laboratories in Austria, Belgium, Canada, France, Germany, Luxembourg, Switzerland, and the United Kingdom.
Standardization
The standardization procedure, based on the PDS method, is described in Grelet et al. (2015). A set of standardization samples were measured on a reference instrument (the “master” instrument) and on each instrument that needs to be aligned (the “slave” in-struments), leading to different response matrices. As reported by Grelet et al. (2015) and Wang et al. (2016), individual FT-MIR spectrometers suffer from instabil-ity over time. To cope with this instabilinstabil-ity, the master cannot be a single instrument. To bring stability to the reference, the master was therefore a fictitious machine that is an average of 18 instruments selected for their stability over time. In this configuration, the reference was linked to and dependent on the network but had a proper and stable spectral response to which all the slaves were matched. The response measured at a pre-cise wave number on the master instrument was related to the response located in a small window around the same wave number measured on each slave instrument. A linear regression was then performed between the spectral response of the master at each wave number and the corresponding windows on the slaves. The coefficients generated for all wave numbers are called standardization coefficients. Whenever a new sample was measured on the slave instrument, the obtained spectra could be standardized to the master response format using these standardization coefficients. A standardization model needed to be designed for every master–slave combination, correcting the shift between each slave instrument and the master instrument.
To match each slave to the master, a set of stan-dardization samples needed to be analyzed by all instruments following the same procedure. To achieve this, interlaboratory studies have been organized in the network every month since December 2011, distributing sets of identical samples to the different participating laboratories. The various partial least squares (PLS) models can make use of different spectral areas, so all the spectral regions containing information need to be standardized independently to the model used. The samples were created to cover sufficient variability in the absorbance values at each wave number to allow a regression between slave and master absorbance values at each region of the spectra. All the sets generated
consisted of 5 samples of raw milk with large and or-thogonal variations in fat (between 2 and 6% wt/vol) and protein (between 2 and 5% wt/vol). The samples were created by blending skim milk, cream, ultrafiltra-tion retentate, and permeate. These sets of samples were produced according to the method described in ISO (1999). Samples were preserved with bronopol (0.02%) and sent at 4°C in isothermal packages containing ice packs and using express delivery (within 24 h). The day of receipt, the milk samples were homogenized and analyzed at 40 ± 2°C in triplicate by each laboratory following a common protocol.
The creation of samples and the generation of stan-dardization coefficients were done centrally at Walloon Agricultural Research Center (Gembloux, Belgium). The instrument-specific standardization coefficients were transferred to the respective labs to be applied on the raw spectra of the corresponding slave spectrom-eters to obtain standardized spectra.
Spectral Reproducibility Within the Network
The spectral variability between instruments of the network was assessed by performing a principal com-ponent analysis (PCA) with the spectra of the master and all 66 instruments before standardization based on the analysis of the 5 common interlaboratory study samples in triplicate. The effect of standardization on the spectral reproducibility of the network was assessed by performing a second PCA with spectra of the master and all 66 instruments before and after standardization based on the same samples. All the spectra were trans-formed in absorbance and interpolated to match the wave number range of the master to observe differences from spectral response only. A PCA was performed on spectra after a first derivative with a gap of 5 and using 212 selected wave numbers, from 968.1 to 1,577.5 cm−1,
1,731.8 to 1,762.6 cm−1, 1,781.9 to 1,808.9 cm−1, and
2,831.0 to 2,966.0 cm−1 (Grelet et al., 2016). Based on
the second PCA, the improvement of spectral repro-ducibility was quantitatively assessed by comparing the global Mahalanobis distances (GH) of the slaves from the master before and after standardization.
Transfer of Individual Calibration Models
To cover the wide diversity of predicted variables that can be found in the milk sector, the effect of stan-dardization on the transfer of models from instrument to instrument was tested for 3 varied models relating to (1) cows’ status (daily CH4 emitted by dairy cows), (2)
fine milk composition (PUFA), and (3) technological properties of milk (fresh individual laboratory cheese yield of milk; FCY). The CH4 model was developed
by Vanlierde et al. (2016) and contains samples from Belgium and Ireland. In this study the Legendre polynomial transformation was removed because the interlaboratory study samples, which are not natural samples, cannot be associated with DIM information. The PUFA model comes from the work performed by Soyeurt et al. (2011) and contains samples from 7 different countries in the European Union. The FCY equation was built within the framework of research by Colinet et al. (2015) based on Belgian samples. All the models were developed using PLS regression with a first derivative and a gap of 5 and using the 212 wave numbers mentioned previously. Calibration and cross-validation statistics of the calibrations are shown in Table 1.
Based on the analysis of the standardization samples, the calibration models were applied to the master and slave instruments before and after the standardiza-tion procedure. All the slave predicstandardiza-tions were then compared with the predictions obtained by the master instrument. The results of the comparison between slave predictions and master predictions, before and after standardization, are expressed by the root mean squared error (RMSE). This reflects the differences between predictions of the master and predictions of the slaves due to specific spectral responses, highlighted by model transfer. However, as RMSE is related to the level and the unit of the variable predicted, a relative error was also calculated. The relative error due to model transfer was calculated by looking at the ratio of RMSE between slaves and master predictions divided by the average of the reference values from the calibra-tion data sets.
Accuracy and Reproducibility of Predictions Over the Network
For the 3 models, the accuracy of the predictions within the network was assessed by comparing the global averages of the master predictions and of the predictions of all slave instruments before and after standardization. Comparisons were done using the Tukey test. The reproducibility of the predictions
within the network was approached by calculating the standard deviation of the predictions of all instruments before and after standardization for the 5 samples and with the 3 models. Reproducibility within the network was also compared with the 10-d repeatability of pre-dictions of individual instruments calculated, for each model, with the analysis of a common UHT milk set during 10 d. All computations, chemometric analyses, and graphics were carried out with programs developed in Matlab version 7.5.0. (The MathWorks Inc., Natick, MA) and PLS toolbox version 4.11 (Eigenvector Re-search Inc., Wenatchee, WA).
RESULTS AND DISCUSSION Spectral Reproducibility Within the Network
From the first PCA done with spectra of all instru-ments before standardization, the principal components from 1 to 4 discriminate the 5 samples of the interlabo-ratory study. Therefore, these principal components comprise spectral information on milk composition. Principal components 5 and 6 allow discriminating the instruments and thus report information on the spectral variability among instruments (Figure 1). On this PCA figure, the spectra of the 66 instruments are represented by a color–symbol association. The hetero-geneous distribution of the instruments highlights the considerable variability of spectral response between the different spectrometers within the network. Princi-pal components 5 and 6 of the second PCA performed on spectra of the master (red stars) and all 66 instru-ments before (blue triangles) and after (green squares) standardization are reported in Figure 2. On this PCA figure, the master showed reduced variability, with spectra concentrated into a small space showing good homogeneity of the reference spectral response. By contrast with the considerable spectral heterogeneity observed without standardization, the spectral vari-ability of the slaves was relatively limited after PDS. Spectral reproducibility was considerably improved after standardization, and standardized slaves’ spectra were concentrated around the master spectra. This
in-Table 1. Calibration and cross-validation statistics of equations used1
Predicted variable Terms Samples Mean SD SEC R2c CV groups SECV R2cv RPDcv
Methane emitted (g/d) 12 532 430 129 66 0.74 5 72 0.69 1.79
Total PUFA (g/100 mL of milk) 11 1,799 0.159 0.045 0.021 0.78 4 0.021 0.77 2.10
Fresh cheese yield (g of curd/100 g of milk) 8 337 26.51 7.11 3.44 0.77 4 3.62 0.74 1.96
1Terms = number of terms used in the regressions; Samples = number of samples in the calibration data sets; SEC = SE of calibration; R2c =
coefficient of determination of calibration; CV groups = number of subsets used in cross-validation; SECV = SE of cross-validation; R2cv =
Figure 1. Principal component analysis (PCA) of the spectra of all instruments before standardization (n = 66). The PCA is based on the
common analysis of 5 standardization samples in triplicate after selection of 212 informative wave numbers and a first derivative. Plot of princi-pal components (PC) 5 and 6 summarizes the spectral variability between instruments. Each color–symbol association represents an individual instrument. Color version available online.
Figure 2. Principal component analysis (PCA) of the spectra of all instruments, including the master, before and after standardization (n =
66). The PCA is based on the common analysis of 5 standardization samples in triplicate after selection of 212 informative wave numbers and a first derivative. Plot of principal components (PC) 5 and 6 summarizes the spectral variability between instruments. Color version available online.
dicates that slaves’ spectral responses were much closer to the master’s spectral response than before and that the spectral homogeneity within the network increased.
The GH from the slaves to the master were calculat-ed to evaluate quantitatively the spectral homogeneity within the network before and after standardization. Before PDS, the GH ranged from 6.17 to 8,6759.36, with an average value of 2,655.92. These very high GH can be explained by the fact that GH is the ratio of the Mahalanobis distance of a spectrum to the aver-age of Mahalanobis distances of a reference data set. Classically, the GH is used to compare a sample with a database in a calibration step or as quality control when using an equation to predict new samples. These databases are built to contain as much variability as possible, which makes the denominator—the global Mahalanobis distance of the database—high. The threshold of 3 is then frequently used to define samples as outliers. In this study the GH was used in a different way, by comparing spectra with a reference containing very low variability, making the denominator really low. This reflects the fact that slaves’ spectra contain an im-portant variability compared with the master spectra, which constitute a homogeneous reference with limited spectral variations. Therefore, the threshold of 3 is not adapted in this case because the GH is used to compare another type of data, with another variability. After standardization the GH ranged from 0.50 to 350.24, with an average of 14.26. These quantitative results, with an average GH from the slaves to the master that is 186 times smaller, confirm the first conclusions ob-tained by visual observation of the PCA. The standard-ization process strongly reduces the spectral variability within the network and makes the spectra closer to the master response, which is expected to have a positive effect on the transfer of models.
Transfer of Individual Calibration Models
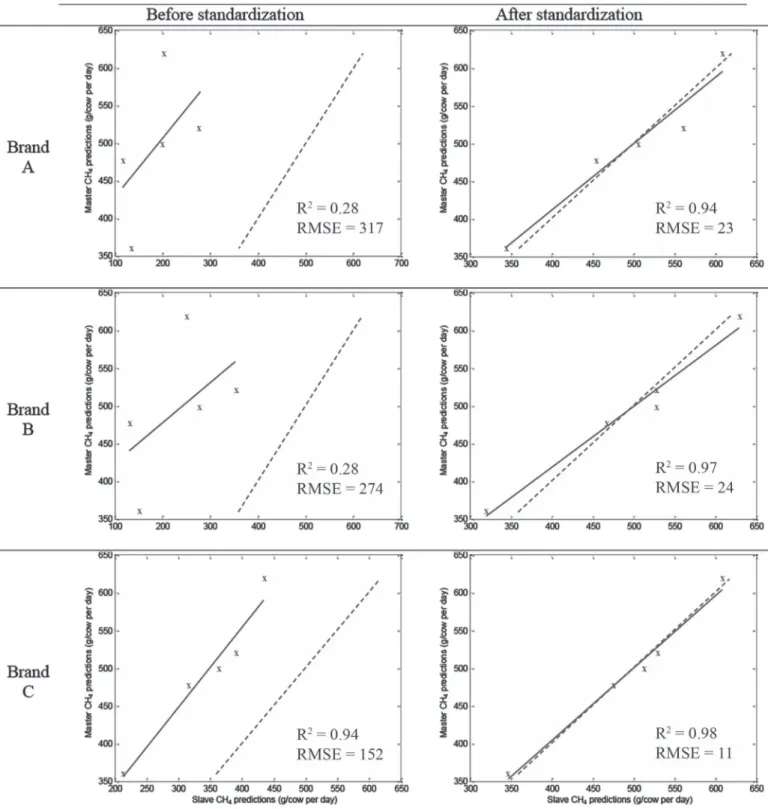
Figure 3 shows the transfer of the CH4 model to an
instrument of each brand before and after standard-ization. It illustrates the bias potentially generated in predictions by the transfer of a model without a prelim-inary step of spectral standardization. The figure also shows the reduction of the differences between slave and master predictions induced by the standardization. For all instruments, the differences between master and slave predictions before standardization were substan-tial, with RMSE ranging from 6 to 422 g/d for CH4,
from 0.0017 to 0.1333 g/100 mL for the PUFA model, and from 0.1110 to 39.57 g of curd/100 g of milk for FCY. Average RMSE for the 66 instruments without standardization was 103 g/d, 0.0315 g/100 mL, and 2.55 g of curd/100 g of milk, respectively (Table 2).
These errors due to model transfer were not negligible, with relative RMSE of 23.9, 19.8, and 9.6%. Without standardization, RMSE fluctuated among brands, with different levels of average (Table 2) and maximum (Ta-ble 3) RMSE. However, these levels are relatively high compared with the standard error of cross-validation of the respective equations (Table 1), meaning that the transfer of models will add a fairly considerable error to the predictions compared with the inherent error of the models. For the CH4 and PUFA models, for all brands
the transfer from the master to other instruments led in the majority of cases to strong bias in the predic-tions, making the transfer of models inconceivable. In the case of the FCY model, for brands A and B the transfer from the master to other instruments also led to important bias in the predictions. Concerning brand C, the average difference from the master prediction before PDS was limited, suggesting that the model could be transferred without the standardization step. However, some instruments show elevated RMSE (up to 3.95 g of curd/100 g of milk), inducing substantial errors in predictions when transferring the model with-out standardization.
After standardization, the RMSE between slave and master predictions was considerably decreased and ranged from 2 to 61 g/d for CH4, 0.0013 to 0.0152
g/100 mL for PUFA, and 0.09 to 2.10 g of curd/100 g of milk for FCY. The average RMSE for the 66 in-struments was reduced to 17 g/d, 0.0045 g/100 mL, and 0.49 g of curd/100 g of milk, respectively (Table 2). Consequently, the relative RMSE decreased after standardization from 23.9 to 4.0% for CH4, from 19.8 to
2.8% for PUFA, and from 9.6 to 1.8% for FCY, meaning that the relative error induced by model transfer was reduced to a more acceptable level for the routine use of the predictions. Indeed, after PDS, the average RMSE was relatively limited compared with the inherent stan-dard error of cross-validation of each model, meaning that the transfer did not add a significant error to the final predictions. The averaged and maximum RMSE still varied among the 3 brands but were considerably decreased for all of them after PDS (Tables 2 and 3). The average differences between master and slave pre-dictions were 6.8, 8.7, and 4.5 times less, respectively. For the 3 models and the 3 brands, the effect of the standardization was a considerable reduction of the dif-ferences from master predictions, allowing the transfer of the models to all slave instruments.
Accuracy, Reproducibility, and Use of Predictions Over the Network
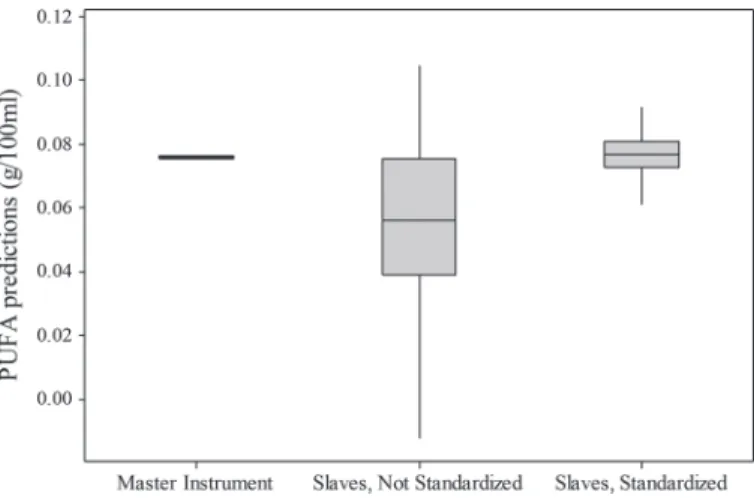
Figure 4 illustrates, for one sample of the interlabora-tory study, the improvement of the reproducibility of
PUFA predictions after standardization compared with predictions from raw spectra. After standardization the distribution of the PUFA predictions was much tighter, meaning that the predictions were more precise. The
mean was also closer than the master prediction mean, showing an increase in the accuracy of the predictions.
To evaluate the effect of standardization on network accuracy for the 66 instruments, the slave prediction
Figure 3. Comparison of methane predictions (g/d) by the master and by 3 slaves from the 3 brands before (left) and after (right)
stan-dardization. Dashed line is y = x; continuous line is the regression line between slave and master predictions. RMSE = root mean squared error. Color version available online.
means were compared with the master prediction means (Table 4). For CH4 and PUFA, the prediction means
for all instruments without standardization were sig-nificantly different from the master prediction means, with 431 versus 496 g/d for CH4 and 0.093 versus 0.117
g/100 mL for PUFA. After standardization, the predic-tion means were 495 g/d and 0.117 g/100 mL, respec-tively, and could not be significantly differentiated from the master prediction mean. For FCY, the prediction means without (25.92 g of curd/100 g of milk) and with (24.46 g of curd/100 g of milk) standardization could not be significantly differentiated from the master pre-diction mean (24.47 g of curd/100 g of milk), although the prediction mean after PDS seemed closer. Network accuracy was significantly improved after standardiza-tion for CH4 and PUFA models. This also seemed to be
the case for FCY, although this could not be demon-strated statistically. After PDS, for the 3 brands taken separately and for each model, there was no difference between the predictions of the master and of the slaves of each brand of instrument (Table 5).
Network reproducibility was improved, with SD between instruments’ predictions reduced after stan-dardization from 126 to 25 g/d for CH4, from 0.0346
to 0.0069 g/100 mL for PUFA, and from 4.89 to 0.69 g of curd/100 g of milk for FCY (Table 4). For the 3 models and for brands A, B, and C, the average 10-d repeatability of the instruments was 45, 22, and 50 g/d per cow; 0.0108, 0.0095, and 0.0063 g/100 mL of milk; and 1.06, 0.72, and 0.57 g of curd/100 g of milk, respec-tively. The reproducibility levels obtained were there-fore in the same order of magnitude as the inherent repeatability of individual spectrometers, meaning that predictions throughout the network were as precise as for an individual instrument. These results show that at the network level the method improved the accuracy and reproducibility of predictions by matching all spec-trometers to a common reference response format.
As shown in Figure 3, improved network reproducibil-ity harmonized the regression lines between spectrom-eters. In breeding studies this increases the usefulness of prediction. Indeed, if intraherd differences can be adjusted through the herd means, heterogeneity of vari-ances due to instruments would be a major challenge in genetic evaluations and could only be approximately adjusted postprediction with very complex methods (e.g., Gengler et al., 2004) if sources of variation, which are numerous and unforeseeable, are correctly identi-fied for each instrument, which is not realistic on a network-wide scale.
General Discussion
The goal of this work was to evaluate the effect of a standardization method on the transfer of multiple models with low accuracy from instrument to instru-ment. A previous study (Grelet et al., 2015) demon-strated that until now it was possible to transfer only high-quality models (fat). The results confirm the first conclusions obtained with the fat model: without the use of a standardization step, the transfer of models leads to considerable errors in the predictions, reducing the value of information from FT-MIR milk spectra for
Table 2. Root mean squared error (RMSE) between master and slaves predictions, averaged by brand, before and after piecewise direct
standardization (PDS; n = 66 instruments)
Item
Methane emitted (g/d) PUFA (g/100 mL of milk) (g of curd/100 g of milk)Cheese fresh yield
Before PDS After PDS Before PDS After PDS Before PDS After PDS
Brand A 231 33 0.0733 0.0089 6.73 1.47
Brand B 348 25 0.1281 0.0027 23.94 1.15
Brand C 73 14 0.0211 0.0039 1.09 0.31
Global average 103 17 0.0315 0.0045 2.55 0.49
Figure 4. Box plot representation of PUFA predictions for a
sam-ple of the interlaboratory study analyzed on 66 instruments for master spectra, nonstandardized spectra, and spectra after standardization after removing aberrant values.
the dairy sector. This study shows that standardiza-tion greatly reduced the spectral variability between spectrometers of the network by bringing the spectra closer to a common reference response. Moreover, the use of PDS strongly increased the reproducibility and accuracy of predictions across all instruments. With the 3 models used (CH4 emitted by dairy cows, PUFA in
milk, and FCY), the developed method substantially reduced the relative error due to transfer of equations. The differences between master and slave predictions were 6.8, 8.7, and 4.5 times less, respectively. This demonstrates the possibility of transferring different models relating to cow status, fine milk composition, or technological properties of milk within the network.
However, the levels of reduction obtained were less impressive than those obtained for the fat model, where the differences between slave and master predictions were reduced on average by a factor of 29.5, whereas the spectral correction was the same. Furthermore, the relative RMSE after standardization were 4.0, 2.8, and 1.8% for CH4, PUFA, and FCY, respectively, whereas
it was only 0.4% for the fat model. Compared with the models used in the study, the main characteristics of the fat model were greater accuracy and a direct and strong signature of fat molecules in the spectra. Figure 5 illustrates the link between the coefficient of determination of cross-validation (R2cv) of the
mod-els and the performances of the transfer. This clearly shows that the error does not depend only on the stan-dardization method, which does not increase the error in the final predictions, but mainly on the quality of
models used. As the standardization did not interfere with the error of the final results, the decision to put effort into developing and sharing a model relies only on the quality of the model regarding the accuracy needed. Williams (2014) proposed a scale regarding the quality of models using the ratio of performance to deviation (RPD), which is the standard deviation of the reference values divided by the standard error of prediction. From this scale, the models with an RPD of <2.3 are very poor and not recommended. Hence, one can think that developing and transferring such models is useless. However, in Williams (2014), the aim was related to quality control of products, and the scal-ing of the RPD was done in line with this objective, which is quite demanding. Furthermore, the paper also mentioned that due to some complications (e.g., dif-ficulties obtaining high variance in the sample set) high RPD can be difficult to obtain, whereas the models can still be of interest for industry or research. In the present study, the models used were not dedicated to quality control, and in another context (e.g., animal management advisory and especially breeding) they can be of interest despite their low accuracy. There are several reasons for this. First, even if these models are phenotypically imprecise, they provide useful informa-tion that was not available before (e.g., predictors for direct traits that were very difficult to obtain). Second, if prediction errors are random, having multiple records reduces the predictive noise globally. Third, in genetic studies, they are repeated throughout a family, and a common genetic background (being heritable) can be
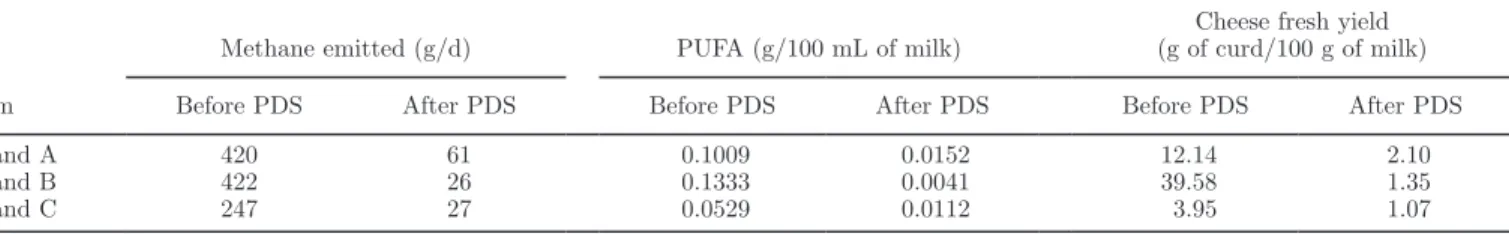
Table 3. Maximum root mean squared error (RMSE) between master and slaves predictions, sorted by brand, before and after piecewise direct
standardization (PDS; n = 66 instruments)
Item
Methane emitted (g/d) PUFA (g/100 mL of milk) (g of curd/100 g of milk)Cheese fresh yield
Before PDS After PDS Before PDS After PDS Before PDS After PDS
Brand A 420 61 0.1009 0.0152 12.14 2.10
Brand B 422 26 0.1333 0.0041 39.58 1.35
Brand C 247 27 0.0529 0.0112 3.95 1.07
Table 4. Accuracy and reproducibility of predictions within the network; comparison of predictions from master, nonstandardized, and
standardized spectra, from samples of the interlaboratory study analyzed on 66 instruments using 3 different Fourier transform mid-infrared calibrations
Item
Mean SD
Master Slaves before PDS1 Slaves after PDS Before PDS After PDS
Methane emitted (g/d) 496a 431b 495a 126 25
PUFA (g/100 mL of milk) 0.117a 0.093b 0.117a 0.0346 0.0069
Fresh cheese yield (g of curd/100 g of milk) 24.47ab 25.92b 24.46a 4.893 0.694
a,bMeans within a row with different superscripts are significantly different by the Tukey test (P < 0.05). 1PDS = piecewise direct standardization.
genetically correlated with other traits of interest (e.g., direct health traits). Usefulness of models with lower phenotypic predictive power is linked to their genetic correlation to other traits of interest. Concretely, there are various examples of how such models with low sta-tistics (RPD < 2.3, which is equivalent to R2 < 0.81)
can be of interest for the dairy sector. For example, Leclercq et al. (2013) studied the genetic variability of lactoferrin based on a model with R2cv = 0.71,
Cec-chinato et al. (2009) used coagulation property models with R2cv between 0.46 and 0.69 to estimate
heritabili-ties and genetic correlations, and the models developed by de Roos et al. (2007) with R2 of 0.72 for acetone and
0.64 for BHB are currently routinely used for ketosis screening. In a genetic study, Bonfatti et al. (2017b) concluded that genetic progress will be faster with good models and that less accurate equations might be suc-cessfully used for breeding purposes. Finally, McPar-land et al. (2015) showed that the ultimate issue for the use of such models for breeding is the existence of genetic correlations. Based on models predicting energy intake and energy balance with R2cv of 0.56 and 0.53,
respectively, they reported genetic correlations between measured and MIR-predicted traits of 0.84 for energy intake and 0.54 for energy balance, indicating that selec-tion based on MIR-predicted variables would improve true energy intake and energy balance. Consequently, the RPD needed should be defined by the users, and this level will be different following their own purposes and applications.
Furthermore, the presented standardization method will improve the usefulness of models with low predictive power. These models provide useful information that was not available before; however, this type of data has to be accumulated across large populations, therefore involving many instruments. Having multiple records reduces the predictive noise globally, but only if these records are comparable across time and instruments. For breeding studies, usefulness of models is linked to their genetic correlation to other traits of interest. How-ever, these studies have to rely on many comparable records. Nonstandardized data would inflate residual— not modeled—variance and therefore reduce heritabil-ity and genetic progress. It would also affect genetic correlations between FT-MIR models and direct traits.
McParland et al. (2015) reported good genetic correla-tions between measured and MIR-predicted traits, but this study was based on a single spectrometer. One can hypothesize that genetic correlation would have been lower with nonstandardized FT-MIR data from several instruments.
In addition to the standardization methods, some important parameters need to be considered to ensure reproducible and accurate predictions for routine use. First, complementary to the homogeneity of spectral response, the robustness of models is an essential el-ement. This capacity of the models to be all terrain is affected not only by the statistical performances of the models (e.g., the RPD), which are well known, but mainly by others factors not frequently mentioned. Models can be transferred into the network, but it is necessary to ensure that calibration data sets cover the spectral variability of the different geographical regions, breeds, and diets to obtain valid predictions. Robust-ness is also affected by the number of latent variables used in the PLS models (which should be reasonable) as well as the precision of the reference method, the use of a repeatability file, the integration of several brands of FT-MIR spectrometers into the data set, and the
Figure 5. Plots representing the link between the quality of the
model (coefficient of determination of cross-validation; R2cv) and
the performance of the transfer by piecewise direct standardization [relative root mean squared error (RMSE) between slaves and mas-ter predictions afmas-ter standardization] from the 5 inmas-terlaboratory study samples analyzed on 66 instruments. CH4 = methane emitted by dairy
cows; PUFA = PUFA in milk; FCY = fresh cheese yield; Fat = fat model used in Grelet et al. (2015).
Table 5. Reproducibility of predictions among the different brands after standardization; comparison of predictions from master and standardized
spectra, from samples of the interlaboratory study analyzed on 66 instruments using 3 different Fourier transform mid-infrared calibrations
Item Master Brand A Brand B Brand C P-value
Methane emitted (g/d) 496.1a 496.0a 487.5a 494.93a 0.967
PUFA (g/100 mL of milk) 0.117a 0.117a 0.118a 0.117a 0.999
Fresh cheese yield (g of curd/100 g of milk) 24.47a 24.50a 24.35a 24.45a 1.000
reproducibility of wave number areas selected within the models. Second, the models have to be developed with standardized spectra to be compatible with the reference spectral response and to be used by all the spectrometers. Third, there is a need for a thorough investigation of the spectral stability of individual in-struments over time, as this could potentially affect the predictions within 2 interlaboratory studies.
The developed method makes it possible to har-monize a network precisely and hence to constitute a standardized historical database usable for multiple purposes. A new model predicting an interesting phe-notype can be applied to past standardized spectra to take advantage of a depth of data (e.g., to realize a genetic study). However, the developed method is valid only once a slave instrument has been integrated in the network and has analyzed the standardization samples. Recently, a study aimed to standardize spectra over instruments and over time using historical data sets as a basis (Bonfatti et al., 2017a). This method al-lows the harmonizing of historical databases and the use a posteriori of models when instruments have not been standardized. However, it is concluded in this work that to guarantee the correct application of the calibration models on a running spectrometer the in-strument should be standardized using the traditional standardization methods, which make use of spectra acquired on common reference samples. The potential risk induced by using historical data sets is that it may correct not only differences attributable to instruments but also those attributable to other factors that may affect the different data sets, such as feed diets, breeds, or seasons. The methods are therefore complementary to retroactively standardize an instrument and to pre-cisely harmonize a running network.
CONCLUSIONS
The results obtained in this work show that spectral standardization allows the transfer and use of multiple models on all instruments and the improvement of the spectral and prediction reproducibility within the network. The transfer does not add significant error to the final predictions, which are largely affected by the quality of the models used. The method makes the equations universal, thereby offering opportunities for data exchange and the creation and use of common robust models at an international level to provide more information to the dairy sector from milk analysis.
ACKNOWLEDGMENTS
The authors thank Interreg (European Regional Development Fund) and the Walloon region for their
financial support of this project. The authors are grate-ful to European Milk Recording (Ciney, Belgium) and particularly Xavier Massart for the management of the network as well as to the laboratories participat-ing in the interlaboratory studies: Qualitätslabor NÖ (Gmünd, Austria), Milchprüfring Oberösterreich (Ried, Austria), QLM–Qualitätslabor St. Michael (Sankt Mi-chael, Austria), and Prüfstelle Labor Rotholz (Jenbach, Austria); Comité du lait (Battice, Belgium) and Cen-tre Wallon de Recherches Agronomiques (Gembloux, Belgium); Central Milk Testing Lab of Edmonton (Ed-monton, Canada); Adecl62 (Maroeuil, France), Analis 53 (St Berthevin, France), Cialso (Auch, France), Galilait (Clermont-Ferrand, France), Labilait (Aumale, France), Lacolait (Roulans, France), LDA39 (Poligny, France), Lial (Rioz, France), Lial-Mc (Aurillac, France), Lilano (Saint Lo, France), Lilco (Surgère, France), Urcil (Carhaix, France), and Uriane (La Capelle, France); MPR–Kirchheim (Kircheim, Germany) and LKV-NRW (Krefeld, Germany); Teagasc (Moorepark, Ireland); Convis (Ettelbrück, Luxembourg); NMR–Wolverhamp-ton (WolverhampNMR–Wolverhamp-ton, UK), NMR–Glasgow (Glasgow, UK), and IML (Bailieborough, United Kingdom); and Suisselab (Zollikofen, Switzerland). The authors are especially indebted to Claire Darimont, Petimat Ki-taeva, Matthieu Dubuisson, Mohamed El Morabit, and Olivier Genard for their valuable work on the organiza-tion of the interlaboratory study (CRA-W, Gembloux, Belgium).
REFERENCES
Bonfatti, V., G. Di Martino, and P. Carnier. 2011. Effectiveness of mid-infrared spectroscopy for the prediction of detailed protein composition and contents of protein genetic variants of individ-ual milk of Simmental cows. J. Dairy Sci. 94:5776–5785. https:// doi.org/10.3168/jds.2011-4401.
Bonfatti, V., A. Fleming, A. Koeck, and F. Miglior. 2017a. Standard-ization of milk infrared spectra for the retroactive application of calibration models. J. Dairy Sci. 100:2032–2041. https://doi. org/10.3168/jds.2016-11837.
Bonfatti, V., D. Vicario, A. Lugo, and P. Carnier. 2017b. Genetic pa-rameters of measures and population-wide infrared predictions of 92 traits describing the fine composition and technological proper-ties of milk in Italian Simmental cattle. J. Dairy Sci. https://doi. org/10.3168/jds.2016-11667.
Cecchinato, A., M. De Marchi, L. Gallo, G. Bittante, and P. Carnier. 2009. Mid-infrared spectroscopy predictions as indicator traits in breeding programs for enhanced coagulation properties of milk. J. Dairy Sci. 92:5304–5313. https://doi.org/10.3168/jds.2009-2246. Colinet, F., T. Troch, V. Baeten, F. Dehareng, P. Dardenne, M.
Sin-dic, and N. Gengler. 2015. Genetic variability of MIR predicted milk technological properties in Walloon dairy cattle. Page 400 in Book of Abstracts of the 66th Annual Meeting of the European Federation of Animal Science. Wageningen Academic Publishers, Wageningen, the Netherlands.
Dal Zotto, R., M. De Marchi, A. Cecchinato, M. Penasa, M. Cas-sandro, P. Carnier, and G. Bittante. 2008. Reproducibility and repeatability of measures of milk coagulation properties and pre-dictive ability of mid-infrared reflectance spectroscopy. J. Dairy Sci. 91:4103–4112. https://doi.org/10.3168/jds.2007-0772.
De Marchi, M., C. Fagan, C. O’Donnell, A. Cecchinato, R. Dal Zot-to, M. Cassandro, and G. Bittante. 2009. Prediction of coagula-tion properties, titratable acidity, and pH of bovine milk using mid-infrared spectroscopy. J. Dairy Sci. 92:423–432. https://doi. org/10.3168/jds.2008-1163.
De Marchi, M., V. Toffanin, M. Cassandro, and M. Penasa. 2014. Invited review: Mid-infrared spectroscopy as phenotyping tool for milk traits. J. Dairy Sci. 97:1171–1186. https://doi.org/10.3168/ jds.2013-6799.
de Roos, A. P. W., H. J. C. M. van den Bijgaart, J. Hørlyk, and G. de Jong. 2007. Screening for subclinical ketosis in dairy cattle by Fou-rier transform infrared spectrometry. J. Dairy Sci. 90:1761–1766. https://doi.org/10.3168/jds.2006-203.
Dehareng, F., C. Delfosse, E. Froidmont, H. Soyeurt, C. Martin, N. Gengler, A. Vanlierde, and P. Dardenne. 2012. Potential use of milk mid-infrared spectra to predict individual methane emis-sion of dairy cows. Animal 6:1694–1701. https://doi.org/10.1017/ S1751731112000456.
Gengler, N., G. R. Wiggans, and A. Gillon. 2004. Estimated het-erogeneity of phenotypic variance of test-day yield with a struc-tural variance model. J. Dairy Sci. 87:1908–1916. https://doi. org/10.3168/jds.S0022-0302(04)73349-4.
Grelet, C., J. A. Fernández Pierna, P. Dardenne, V. Baeten, and F. Dehareng. 2015. Standardization of milk mid-infrared spectra from a European dairy network. J. Dairy Sci. 98:2150–2160. https://doi. org/10.3168/jds.2014-8764.
Grelet, C., J. A. Fernández Pierna, P. Dardenne, H. Soyeurt, A. Van-lierde, F. Colinet, N. Gengler, V. Baeten, and F. Dehareng. 2016. Development of Fourier transform mid-infrared calibrations to predict acetone, β-hydroxybutyrate and citrate contents in bovine milk through a European dairy network. J. Dairy Sci. 99:4816– 4825. https://doi.org/10.3168/jds.2015-10477.
Hempstalk, K., S. McParland, and D. P. Berry. 2015. Machine learn-ing algorithms for the prediction of conception success to a given insemination in lactating dairy cows. J. Dairy Sci. 98:5262–5273. https://doi.org/10.3168/jds.2014-8984.
ISO (International Organization for Standardization. 1999. Whole milk—Determination of milk fat, protein and lactose content— Guidance on the operation of mid-infrared instruments. Standard number 9622:1999. ISO, Geneva, Switzerland.
Lainé, A., C. Bastin, C. Grelet, H. Hammami, F. G. Colinet, L. M. Dale, A. Gillon, J. Vandenplas, F. Dehareng, and N. Gengler. 2017. Assessing the effect of pregnancy stage on milk composition of dairy cows using mid-infrared spectra. J. Dairy Sci. 100:2863– 2876. https://doi.org/10.3168/jds.2016-11736.
Leclercq, G., N. Gengler, H. Soyeurt, and C. Bastin. 2013. Genetic variability of the mid-infrared prediction of lactoferrin content in milk for Walloon Holstein first-parity cows. Livest. Sci. 151:158– 162. https://doi.org/10.1016/j.livsci.2012.11.002.
McParland, S., G. Banos, E. Wall, M. P. Coffey, H. Soyeurt, R. F. Veerkamp, and D. P. Berry. 2011. The use of mid-infrared
spec-trometry to predict body energy status of Holstein cows. J. Dairy Sci. 94:1222–1239. https://doi.org/10.3168/jds.2010-3965. McParland, S., E. Kennedy, E. Lewis, S. G. Moore, B. McCarthy, M.
O’Donovan, and D. P. Berry. 2015. Genetic parameters of dairy cow energy intake and body energy status predicted using mid-infrared spectrometry of milk. J. Dairy Sci. 98:3651–3661. https:// doi.org/10.3168/jds.2014-8892.
McParland, S., E. Lewis, E. Kennedy, S. G. Moore, B. McCarthy, M. O’Donovan, S. T. Butler, J. E. Pryce, and D. P. Berry. 2014. Mid-infrared spectrometry of milk as a predictor of energy intake and efficiency in lactating dairy cows. J. Dairy Sci. 97:5863–5871. https://doi.org/10.3168/jds.2014-8214.
Rutten, M. J. M., H. Bovenhuis, K. A. Hettinga, H. J. F. van Valen-berg, and J. A. M. van Arendonk. 2009. Predicting bovine milk fat composition using infrared spectroscopy based on milk sam-ples collected in winter and summer. J. Dairy Sci. 92:6202–6209. https://doi.org/10.3168/jds.2009-2456.
Soyeurt, H., D. Bruwier, J.-M. Romnee, N. Gengler, C. Bertozzi, D. Veselko, and P. Dardenne. 2009. Potential estimation of major mineral contents in cow milk using mid-infrared spectrometry. J. Dairy Sci. 92:2444–2454. https://doi.org/10.3168/jds.2008-1734. Soyeurt, H., F. Colinet, V. Arnould, P. Dardenne, C. Bertozzi, R.
Renaville, D. Portetelle, and N. Gengler. 2007. Genetic variability of lactoferrin content estimated by mid-infrared spectrometry in bovine milk. J. Dairy Sci. 90:4443–4450. https://doi.org/10.3168/ jds.2006-827.
Soyeurt, H., F. Dehareng, N. Gengler, S. McParland, E. Wall, D. P. Berry, M. Coffey, and P. Dardenne. 2011. Mid-infrared prediction of bovine milk fatty acids across multiple breeds, production sys-tems, and countries. J. Dairy Sci. 94:1657–1667.
Soyeurt, H., F. Dardenne, G. Dehareng, D. Lognay, M. Veselko, N. Marlier, and N. Gengler. 2006. Estimating fatty acid content in cow milk using mid-infrared spectrometry. J. Dairy Sci. 89:3690– 3695. https://doi.org/10.3168/jds.S0022-0302(06)72409-2. van Knegsel, A. T. M., S. G. A. van der Drift, M. Horneman, A. P. W.
de Roos, B. Kemp, and E. A. M. Graat. 2010. Short communica-tion: Ketone body concentration in milk determined by Fourier transform infrared spectroscopy: Value for the detection of hyper-ketonemia in dairy cows. J. Dairy Sci. 93:3065–3069. https://doi. org/10.3168/jds.2009-2847.
Vanlierde, A., M. L. Vanrobays, N. Gengler, P. Dardenne, E. Froid-mont, H. Soyeurt, S. McParland, E. Lewis, M. H. Deighton, M. Mathot, and F. Dehareng. 2016. Milk mid-infrared spectra enable prediction of lactation-stage dependent methane emissions of dairy cattle within routine population-scale milk recording schemes. Anim. Prod. Sci. 56:258–264. https://doi.org/10.1071/AN15590. Wang, Q., A. Hulzebosch, and H. Bovenhuis. 2016. Genetic and
envi-ronmental variation in bovine milk infrared spectra. J. Dairy Sci. 99:6793–6803. https://doi.org/10.3168/jds.2015-10488.
Williams, P. 2014. Tutorial: The RPD statistic: A tutorial note. NIR News 25:22–26. https://doi.org/10.1255/nirn.1419.