Abstract—This paper addresses the problem of security monitoring and situation awareness in very large interconnected transmission systems, with particular emphasis on the continental European grid. An innovative approach of situation adapted displaying of the operational state of a large network is proposed, which is based on state-of-the-art cognitive methods. This approach is able to be processed online and makes the displays available to all participating transmission system operators. The proposed approach for an improved situation awareness of different security threats such as wide-area split of the system and cascading overload is applied with a very large simulator model of the continental European transmission system of about 15,000 buses.
Index Terms— cascade overload, operational control, power system analysis, power system control, situation awareness, supervisory control, transmission system operation, wide-area system split
I. INTRODUCTION
OWER system control in the context of interconnected transmission system operation is characterized by huge amounts of technical information to be handled by the various transmission system operators (TSOs). The variety of organisational approaches of these different TSOs (e.g. collaborative, with active or passive coordination, hierarchical [1]), who may also be of manifold nationalities, as in Europe, increases the complexity of performing these tasks. Indeed while physical phenomena of an interconnected grid do not end at administrative borders, system monitoring is usually restricted to the particular TSO areas, thus not reflecting the behaviour and the wide area effects of the whole interconnected system. In particular this limitation becomes evident in case of large disturbances which significantly affect several control areas within the interconnection (like, e.g. the incident of system split of UCTE on Nov. 2006 [2]). This motivated even stronger the efforts for broader data exchange between individual TSOs in both day-ahead (e.g. DACF [3],
The presented contents are developed in the frame of the research project PEGASE. This project is founded by the 7th Framework Programme of the European Commission under grant agreement number 211407. It is part of the thematic priority Energy in the specific programme Cooperation.
R. Hoffmann and G. Krost are with the Institute of Power Systems, Faculty of Engineering, University Duisburg-Essen, Duisburg, D-47057, Germany
F. Capitanescu and L. Wehenkel are with the Department of Electrical Engineering and Computer Science – Montefiore Institute, University of Liège, Liège, B-4000, Belgium
F. Promel is with Tractebel Engineering GDF SUEZ, Brussels, B-1200, Belgium
[4]) and close to real-time frameworks.
In order to manage potential security problems that span several TSO control areas of an interconnected system there is a stringent need to develop appropriate information processing tools able to handle much larger parts of the whole interconnected system (when information is made available) than currently implemented ones focusing on single control areas. Furthermore, since efficient system monitoring is paramount issue for effective operation and control, the results of such tools have to be presented in a proper way to the individual TSOs. Hence, after becoming aware of the situation, the TSO could decide, if control actions or alternative options (e.g. to collect or furnish information) are necessary within its own area. But in stringent conditions, the TSOs have a limited time, depending on the security threat and systemic constraints, to act in order to maintain system integrity.
Historically, the horizon of transmission system monitoring was set - and continuously enlarged - by the available data and computational resources of the control systems. The complexity of transmission system control led to the principle to display all data which are available. However, today much more information about the system is available (e.g. additional measurements of PMUs, security analysis results etc.) which requires an adequate choice of the most significant information to display in a given operational context.
Modern human machine interaction sets the focus mainly on importance, relevance and priority of information. Certain design methods in this field are based on the theory of situation awareness [5]. The usage of situation awareness principle is quite common in the field of aviation and air traffic control as well as in military command & control.
In the frame of the PEGASE1 project [1] an interface for
control centres is being developed, which aims at generating situation awareness to support a proper decision making process over the very large European grid. The large area covered as well as the complexity of the whole system set the requirement of advanced user interfaces that is to provide superior and condensed information from all control areas of the entire grid to the dispatchers of all control centres. The
1 The European project PEGASE (Pan-European Grid Advanced
Simulation and State Estimation) was initiated in order to propose technical and organisational solutions to handle the specific requirements of a large interconnected system. In the frame of this project a real-time simulator of the continental European interconnected grid as well as analysis tools (e.g. State Estimation, Steady State Optimization, Time-Domain Simulation and Modelling) are under current development.
Situation Adapted Display of Information for
Operating Very Large Interconnected Grids
R. Hoffmann, F. Promel, F. Capitanescu, G. Krost, and L. Wehenkel
information system behind this application could be used for a shared collaborative control strategy as well as in coordinated or hierarchical control organisations.
For this purpose the need for an easy understandable displaying of the system state was identified: it comprises the
local network state, assigned to each control area, as well as
the global network state assigned to the whole interconnected system. This paper provides an approach to design the way of displaying certain (local and global) network states in order to yield situation awareness.
The rest of this paper is organized as follows: section II describes the methods and issues of situation awareness and a related interface design strategy. Section III explains the idea of displaying operational modes to improve situation awareness. Section IV outlines processing of network states. Section V illustrates an application of displaying network-states for real scenarios happened in the past, while section VI sketches the implementation of a displaying-application into a graphical user interface to give an overview to the association with operational control. Section VII concludes this paper.
II. SITUATION AWARENESS AND INTERFACE DESIGN Human-machine-communication (HMC) and –interaction (HMI) is a field of activity of different scientific disciplines. The focus here is set on the transmission of information from the technical system to the human being. Beyond the problem of channel capacity or noise influences right out from information theory the performance of information receiving is a central, non-trivial issue. Furthermore the performance of receiving information by a human being is an active field of work in neuroscience and psychology, belonging thus to the area of cognitive science.
The HMI is differently defined by several disciplines. In the field of programming – respectively software-engineering – it is the displaying system or unit. Cognitive science describes the human perception as the interface. According to information theory we have to consider that the interface is the match of transmitted information and received respectively perceived information. In other words the main objective is to generate the maximum possible match between provided information and perceived information. This objective provides only quantitative information, but is unable to yield qualitative order of information such as: priority, relevance and necessity. The latter is in particular necessary, if:
• the amount of available data is too high to ensure a collateral perception of information within reasonable time,
• the timeframe for awareness itself is limited or critical, • the all-embracing system has in general a raised
complexity,
• the monitoring of the system has a security relevance by which the safety integrity is based on immediate recognition.
In order to consider these elements there is a need for focussing on coherence of information and situation. In other words, a situational quality has to be prioritized.
The approach of situation awareness (SA), introduced by Endsley [6], focuses mainly the implementation of an
ergonomic presentation of a situation. SA itself is defined as:
The perception of elements in the environment within a volume of time and space, the comprehension of their meaning, and the projection of their status in the near future [6]. The basic
model of SA can be seen in Fig. 1. We have to emphasize the three levels of SA:
• Level 1 is mainly the issue to be aware that certain evidences occur. A user interface supports this level by simplification and limitation of significant and relevant information.
• Level 2 of SA needs information, which is more detailed, but still ordered by priorities and coherence of the situational aspects regarding goals and objectives of the control subjects.
• Level 3 of SA is delivering prospects of what is likely to happen and an idea how to control the situation. Hence, a proper basis for decision making is achieved.
Situation Awareness
Level 3 Projection of future state Level 2 Comprehension of situation
Individual factors
State of the Environment
Level 1 Perception of significant elements
Decision Performance of Action Human Entity Abilities Experience Training Goals & objectives
Preconceptions Expectations
feedback System factors
Long term memory Automaticity Cognitive processes
Fig. 1 Model of situation awareness corresponding to Endsley [6].
SA theory followed several methodologies for development and design of user interfaces. Ecological interface design (EID) was introduced by Rasmussen and Vicente [7] as an approach to interface design for system control with raised complexity [8]. The methodology in the frame of the PEGASE project mainly depends on the principles given by EID.
The application of the described theory and principles is not quite common in the field of electric power system control in contrast to, e.g., control of nuclear power plants [9].
On the other hand, incidents like the blackout of the Italian system on 28th September 2003 [10] and the system
distur-bance of whole UCTE on 4th November 2006 [2] revealed that
there is a lack of situation awareness for several power system security threats, in particular for the following issues:
• Split/islanding of the transmission system • Overload cascades
• Inter-area power oscillations • Circular active power flows
According to SA theory it is aspired to find mental models [6], which could be used to increase or improve the SA of these issues in power system control centres. If we consider mental models during interface development, definitions of schemata will be reached, which could be visualised respectively applied for operational control tasks.
Therefore we introduce the application called global network state based on displaying operational modes.
III. DISPLAYING OPERATIONAL MODES OF TRANSMISSION NETWORKS TO IMPROVE SITUATION AWARENESS
A. Operational Modes
The definition of operational modes of electric power systems was introduced by DyLiacco [11], according to whom, the following classification of operating states respectively modes of operation can be made:
• Normal operation mode (normal state) • Preventive operation mode (alert state) • Corrective operation mode (emergency state) • Restorative operation mode (restoration state) The definition of each mode may slightly vary in different TSOs, but several criteria – like N-1 – will cause in each TSO the same mode of operation.
The operational modes are related to the system integrity and security. They express whether the current situation satisfies the security criteria taking or not into account the available control actions that may be implemented in the assumed timeframe in order to satisfy the security criteria.
These modes have been initially defined according to static security criteria (e.g. overloads, under- or over-voltages, voluntary or involuntary loss of load). The border between these modes becomes less clear-cut when taking into account dynamic aspects (e.g. stability of: frequency, angle, and voltage). For instance an unexpected frequency excursion could lead the TSO to consider the system operating in an alert state. Furthermore, performing accurate dynamic time-domain simulation close to real-time (e.g. for the current state or forecasted state) for a large number of contingencies (e.g. at least the N-1 events) is nowadays an unaffordable computational burden for very large power systems. Despite significant progress obtained as regards the computational speed of time-domain simulation, it is still practically impossible to classify the current (or foreseen) operating state with respect to N-1 dynamic security within an acceptable response time. Nevertheless, if dynamic security criteria are not met in the current state (e.g. the system is undergoing an instability, which corresponds to the emergency state), this can be recognized provided that appropriate (fast) real-time measurements are available. Restorative state can be easily recognized likewise.
B. Scheme of Global and Local Network State
The distinction of the operational modes has an analogy to the visual occurrence of a traffic light. Regarding the issue to display operational modes an already trained pattern is a benefit for the SA purpose and with it an applicable mental model. The approach of global network state is in other words the application of a well known alerting pattern for a human operator in the field of monitoring a large interconnected transmission system. The network states can be understood as the visual representation of the recommended operational mode amended by the visual representation of the edge cases respectively systemic constraints ‘blackout’ and ‘no information’. The complete scheme is as follows:
• Green: normal • Yellow: alert • Red: emergency • Magenta: restoration
• Black: blackout
• Grey: no information available
The consideration of edge cases, which are constraints to the monitoring system, is a necessary condition (compare with [8]). The blackout state has to be distinguished from the
restoration mode, because it is a situation, which lacks all
main characteristics of supervisory control (e.g. actability of operative control, estimation and traceability in time). This chaotic state has a different meaning than a planned and organised restoration phase following such an incident. Considering the technical constraint that there may lack information about the state of an area, is also an important element to avoid mislead SA by explicitly providing the fact of “no information available”.
Even though a proper schema of a mental model will evoke level 2 and level 3 SA (compare with [6]), the complexity of transmission system operational control needs several more detailed information displays for comprehension. Displaying network states will clearly improve level 1 SA by the warning characteristic. The comprehension of the situation at all, which phenomenon or incident may take place, could not be covered only by the schema of global network state.
IV. PROCESSING OF NETWORK-STATES
A. Description of Significant Operational Tasks
We briefly describe the proposed approaches to process the network states for the various system threats mentioned in section II.
1) Split of the transmission system (islanding)
The identification of an interconnected system split requires building its complete topology at an assumed rate (ideally at least 10 seconds), based on the actual topology of the whole interconnection. This assumes that the topological structure of each individual TSO is made available at an upper (e.g. European) TSO level. Frequencies of originated islands and their power balances are important information to be conveyed to the TSOs. In greater detail, the locations where the split happened and the existence of synchronization equipment at, or close to, these locations are further relevant information items.
2) Overload cascades
We focus on the SA for developing overload situations especially at TSO borders and tie lines. To this end we simulate the complete interconnected system evolution during a given time horizon including overload trips. The system states are obtained by performing security analysis in each system. In particular the emergency (resp. restoration) state does not need security analysis but only to check whether in the actual state any line is overloaded (resp. if some areas are currently not supplied). We use the Multi Dimensional Scaling (MDS) algorithm [12] in order to provide an additional 2D display to the TSO, allowing focusing immediately on the critical transmission corridors. The MDS algorithm is fed with the geographical coordinates of monitored lines as well as with an electrical distance of the phenomena to emphasise. For the overload cascade threat, the chosen metric distance is related to the consequences of an outage of each monitored tie-line. Consequently the MDS approach aims at locating
more closely on the display those lines, whose disconnection would have similar consequences.
3) Inter-area power oscillations
We assume that several PMUs are installed within each TSO area (e.g. around few hundreds in the whole European transmission system) in some strategic places. The continuous observation of PMUs voltage angles at a 100 ms time rate will enable to detect the onset of oscillations and to identify typical (or critical) oscillating modes. To this end, we use the Statistical Process Control (SPC) [13] and the discrete Fourier’s transformation as data processing methods, in order to extract the relevant information before displaying it to the operators.
4) The power flow phenomena of circular power flows
The aim is to identify whether there really exist circular flows in the interconnected system and what is their amount. These circular flows lead to suboptimal operation because of unnecessary power losses and possible transmission congestions. This evaluation requires the knowledge of active power flows on each border of neighbouring TSOs. The circular flows can be found by a graph based search. Additionally, information about flow control means (like phase-shifters or HVDC links) should be as well displayed.
B. Attempt to Standardize the Processing of Network States
In order to improve the situation awareness in an interconnected power system operated by several TSOs there is a need that individual TSOs share among them in real-time their network states for security problems that may affect other control areas. Clearly, local voltage problems or local topology-changes in an individual system are not of interest for the whole interconnection as long as there is no risk of propagation.
The information needed for the determination of the network state for an individual TSO depends on the security threat. The maximum amount of information needed for the determination of the network state consists of: SCADA and PMU measurements, the actual topology (e.g. given by status of breakers), and solution of the state estimator, which exploits the all information mentioned previously. This information has to be processed as soon as it becomes available in order to determine whether there is a security threat. For instance the network topology is updated as soon as a breaker changes its status in order to identify whether network splitting or loss of load occur. Fast PMU measurements allow identifying whether weakly damped inter-area power oscillations occur.
Note that previous system states may considerably help in determining the network state. For instance restorative and blackout states are the easiest to recognize because some areas are not energised, as a consequence of protection trips or voluntary actions made by the TSO. Emergency state is also quite straightforward to distinguish, generally by mere SCADA measurements, because some operational limits are violated (e.g. overloads, under-voltages).
On the other hand distinguishing between normal and alert state requires relying on the output of the state estimator and simulations. The latter is used to perform the static security analysis for a list of contingencies selected according to the operational rules. If this analysis detects that some limits are violated in the post-contingency states and that these cannot be
removed by post-contingency corrective actions, it means that the system is in alert state (preventive actions are needed).
We have discussed in section III A) that carrying out the simulations needed to recognize dynamically alert states is still mostly incompatible with real-time requirements, but when the system is, from a dynamic point of view, in emergency or restoration state, this may be recognized from real-time measurements..
Furthermore, the proper identification of some security threats requires that some information is shared for the whole interconnection at a superior level (e.g. in a common monitoring service centre under a coordinated control strategy or in a common information platform according to a collaborative control strategy). For instance the identification of the interconnection islanding (respectively inter-area oscillations) generally requires the knowledge of the breaker statuses (respectively the voltage angles measured by PMUs) on the whole interconnection.
V. VISUALISATION OF GLOBAL NETWORK STATE This section presents several approaches for visualising the global network state (GNS). Adopting the analogy of a traffic light for a visualisation of the GNS fits the terms of a mental model (compare with [6]). In other words the GNS representation is a dedicated schema to satisfy a mental model.
A. Rendering of Global Network State
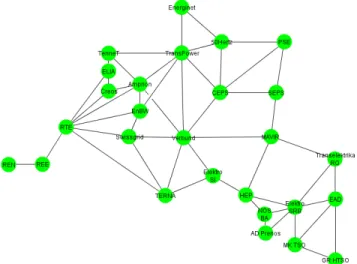
We limit the possible representations of the GNS to two alternative renderings. Fig. 2 and Fig. 3 show the rendering of GNS in a so-called connectivity chart. In principle this is a graph, which visualises the qualities “operational mode”, “connectivity of transmission systems” and a rough idea of “allocation of transmission systems”. The variant shown in Fig. 2 relates the GNS to the TSOs of continental Europe (ENTSO-E regional group, former UCTE [14]), the one shown in Fig. 3 relates to the participating countries of the regional group.
Fig. 2 GNS representation by connectivity chart of TSOs (continental Europe, ENTSO-E)
Fig. 3 GNS representation by connectivity chart of countries (continental Europe, ENTSO-E); abbreviations according to alpha 2 code of ISO 3166-1
A more sophisticated rendering is the representation of the GNS by country shapes like illustrated in Fig. 4. This variant uses the ENTSO-E map of participating countries [14]. The idealised mapping of the geographical spread combines pattern matching with reduction of distractive elements. In comparison to the connectivity chart this variant lacks an explicit representation of the “transmission system connectivity”. Nevertheless the coherence to the physical, spatial appearance provides this information in subsidiary way. The underlying principle could also be adapted for relating all network states to TSO-shapes.
Fig. 4 GNS representation by country shapes (continental Europe, ENTSO-E)
B. Demonstration of the Italian Incident 2003
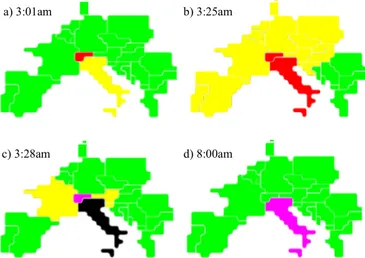
We first want to demonstrate the application of the GNS schema for the incident on 28th Sept. 2003 [10]. The order of
events was a cascade overload causing a cascade of line trips, followed by the disconnection of the Italian grid, which culminated finally in the complete blackout of the Italian transmission system. In Fig. 5 and Fig. 6 the adopted GNS evolving over the time is shown (Fig. 5 shows the connectivity variant, Fig. 6 the country shape variant). The given network states result as described in the following.
Fig. 5 Evolution in time of the global network state applying connectivity chart for the incident on 28th Sept. 2003 [10].
Fig. 6 Evolution in time of the global network state applying country shapes for the incident on 28th Sept. 2003 [10].
At 3:01am – see a) – a fault caused the trip of a line in Switzerland. Hence certain overloads of lines in Switzerland have been detected, which leads to operation in emergency
mode. At this time the Italian system has had a negative
generation-consumption balance. In consequence, a high import of electrical power via the tie-lines to the grid of Switzerland in combination with the circumstance of its
emergency mode causes for the Italian system the alert mode.
Around 3:25am – see b) – a first trip cascade started, which caused further overloads of lines and assets also in the Italian system. This led also to the emergency mode for the Italian system. At the same time frequency alert (over-frequency f > 50.20 Hz) was indicated in all control centres of the first UCTE zone, which evoked the alert mode for the affected systems. A few seconds after 3:28am – see c) – the Italian system was blacked out. The TSO of Switzerland already started restoration of its system. The TSOs of France, Austria and Slovenia have had several trips by protection devices till this time, which retained the alert mode. At 8:00am – see d) – the Italian transmission system was in restoration process while the remaining UCTE system was already restored respectively back to normal mode.
Note that especially between 3:01am and 3:25am the availability of such an information display would have
a) 3:01am b) 3:25am
c) 3:28am d) 8:00am
a) 3:01am b) 3:25am
generated an awareness of the situation. During this period of time several control actions to reduce the power import of the Italian system could have been made, hence an avoidance of trips caused by cascading overloads and eventually the blackout of the Italian system.
C. Demonstration of the European Incident 2006
Another interesting incident of the past in continental Europe is the system disturbance on 4th Nov. 2006 [2]. In Fig.
7 the GNS schema (country shapes) applied to this scenario is shown. Here the situation around 10:11pm is depicted. The UCTE system has been split into three system islands (zones “west”, “north-east” and “south-east”). The “breaklines” remained through different TSOs (countries: Germany, Austria, Hungary and Croatia). Because of the unbalance of power generation and consumption in the aggregated zones, different operational modes resulted regarding frequency alert in control centres: the western zone has had an under-frequency of around 49.2 Hz (later on 49.0 Hz) while the north-eastern zone has had an over-frequency of 50.3 Hz (later on 50.4 Hz). The south-eastern zone has had a lesser under-frequency of 49.8 Hz at this time. Concerning the impact on frequency alert the certain depicted operational modes follow. The TSO areas and respective countries, which contain the “breaklines”, are in a restorative mode of operation, because they suffered from unscheduled asset trips.
Fig. 7 Application of the GNS for the incident on 4th Nov. 2006 [2]
The application of the GNS could have provided very important information for situation awareness of system split (e.g. number and approximate spread of islands), which clearly lacked during the real event.
VI. IMPLEMENTATION OF THE GLOBAL-NETWORK-STATE IN A SHARED USER INTERFACE
In section VI we have shown that GNS applications could enhance or improve situation awareness for the operation of the European interconnected grid. The GNS schema works with a language-independent mental model, which is very useful regarding utilization in a shared control of an interconnection containing several nationalities.
Displaying GNS is just one tool for an interface application. Nevertheless it has to be embedded into a more elaborated operator interface. In the following we briefly sketch, how an implemented GNS display is working in a shared information interface for the TSOs.
In Fig. 8 a preliminary graphical user interface (GUI) developed in the PEGASE project is shown. The depicted variant is realised for a single display work desk. The GNS display is one of so-called “monitors”, which could be selected by a tab-control. The monitors are framed by a chart for iconic warnings and another one for event markers.
Fig. 8 Screenshot of the a preliminary user interface in the frame of the PEGASE project
The situation displayed in Fig. 8 is a snapshot of the incident 2003 at around 3:25am and depends also on the working status (e.g. acknowledgements of the user). At this state the GNS provides the already known operational modes. The displayed warning icons represent (top down): alert of overloaded transmission line(s), warning of over-frequency, and warning of unscheduled breaker-event(s). The event markers link to certain asset related events, which could be localised in a topology related view (the corresponding monitor is not depicted here).
The shown display is designed for remote access of each TSO in the interconnected grid. Furthermore it is designed for an operation on a windows-based work desk PC.
VII. CONCLUSION
The quoted incidents in the European grid as well as similar wide-area events that occurred worldwide revealed clearly that there is a need for a more sophisticated operational control process than the autonomous dispatching of several control areas. In the today’s more and more uncertain power system operation environment within Europe, a feature which will certainly become even more acute in the future mainly due to the installation of increasing amounts of intermittent generation, there is a trend towards the creation of international coordination centres (e.g. in the way of shared service centres like Coreso [15]). The good experience reported in the operation of such centres may encourage other TSOs to take part of these centres or create new ones.
However, whatever control strategy may finally be selected – a more collaborative one (characterised by a broad sharing of information) or a more coordinated one (so that information will also be administrated) – both options unavoidably intend to respond to the need for monitoring and control of larger and larger geographical regions and more complex electric power systems.
Therefore, displaying comprehensive information about the state of the wide-area interconnection is urgently needed
for its operation and control. Further, a more efficient way of monitoring should be aspired, because of the raised complexity on the one hand, and because of the growing amounts of available information (e.g. PMU measurements, state estimation etc.) on the other hand. Adapting the information display to the situation at hand in a dynamical way, as well as to the related operational task, would allow one to manage complexity by selecting only the most relevant information in a given context and presenting it in a way appropriate for immediate situation awareness and subsequent decision making within adequate time.
The proposed method of global network state displaying is an applicable and appropriate option for such a purpose. The schema corresponds to a mental model, which is broadly present in our technical environment, thus easy under-standable. Moreover it is based on language-independent information presentation, which is particularly useful with regard to multinational and multilingual shared supervisory control, because of the overall accessibility.
VIII. ACKNOWLEDGMENTS
The authors acknowledge their funding by the FP7 EC project PEGASE funded by the European Commission.
F. Capitanescu and L. Wehenkel acknowledge the support of the Belgian Network DYSCO, funded by the Interuniversity Attraction Poles Programme, initiated by the Belgian State, Science Policy Office. The scientific responsibility rests with the authors.
IX. REFERENCES
[1] Pan European grid advanced simulation and state estimation (PEGASE) project, http://www.fp7-pegase.eu/, 2008.
[2] UCTE, “Final Report - System Disturbance on 4 November 2006”, Brussels, 2007, Available: https://www.entsoe.eu/resources/ publications/former-associations/ucte/other-reports/
[3] UCTE, “Annual Report 2003”, Brussels, 2003, Available:
https://www.entsoe.eu/resources/publications/former-associations/ucte/annual-report/
[4] J. Vrsecky, P. Panciatici, “Day ahead congestion forecast for a secure operation of the European transmission system”, Proceedings of Power Systems Computation Conference (PSCC), Liège, Belgium, 2005 [5] J. Noyes, M. Bransby, “People in Control: Human Factors in Control
Room Design”, IEE, London, 2001
[6] M. R. Endsley, B. Bolté, D. G. Jones, “Designing for Situation Awareness – An Approach to User-Centered-Design”, CRC Press, Boca Raton, 2003
[7] J. Rasmussen, K.J. Vicente, “Coping with human errors through system design: Implications for ecological interface design”, International Journal of Man-Machine Studies, vol. 31, pp. 517-534, 1989
[8] C. M. Burns, J. R. Hajdukiewicz, “Ecological Interface Design”, CRC Press, Boca Raton, 2004
[9] C.M. Burns et al., “Evaluation of Ecological Interface Design for Nuclear Process Control: Situation Awareness Effects”, Human Factors: The Journal of the Human Factors and Ergonomics Society, vol. 50, pp. 663-679, August 2008
[10] UCTE, “Final Report of the Investigation Committee on the 28 September 2003 Blackout in Italy”, Brussels, 2004, Available:
https://www.entsoe.eu/resources/publications/former-associations/ucte/other-reports/
[11] T.E. Dy Liacco, “The Adaptive Reliability Control System”, IEEE Transaction of Power Apparatus and Systems, 1967, vol. PAS-86, Nr. 5, pp. 517-531, May 1967
[12] F. Belmudes, D. Ernst, L. Wehenkel, “Pseudo-geographical re-presentations of power system buses by multidimensional scaling”,
Proceedings of the 15th International Conference on Intelligent System Applications to Power Systems, 2009
[13] J.R. Thompson, J. Koronacki, “Statistical Process Control: the Deming Paradigm and Beyond”, Chapman & Hall/CRC, 2002
[14] European Network of Transmission System Operators for Electricity (ENTSO-E), https://www.entsoe.eu/system-operations/regional-groups/ [15] Coreso SA, http://www.coreso.eu/
X. BIOGRAPHIES
Robert Hoffmann obtained his Master of Science in Electrical Engineering and Information Technologies in 2009 from the University of Applied Sciences Duesseldorf, Germany. He is research associate with the Institute of Power Systems within the Faculty of Engineering at the University Duisburg-Essen. His main research interests are operational control of power systems, system-interfaces to human operator, security systems in power technology, and risk & reliability assessment of energy and power systems. Robert Hoffmann is member of VDE.
François Promel graduated in Electrical Power Engineering from the Free University of Brussels in 1991. He joined Tractebel Engineering S.A. (GDF-Suez) in 1992. He puts his expertise in Energy Management System (EMS) functions, especially modelling issues, state estimation, optimisation, time domain simulation and dispatcher training system. He is involved in research programs about knowledge management and human machine interface for power application software.
Florin Capitanescu graduated in Electrical Power Engineering from the University ``Politehnica'' of Bucharest in 1997. He obtained the Ph.D. degree from the University of Liège in 2003. His main research interests include optimization methods, in particular optimal power flow, and voltage stability. Gerhard Krost (M’1999) received the diploma degree in power systems engineering from Darmstadt Technical University in 1978. Working at Erlangen University from 1978 to 1985 in the field of power system harmonics calculation and measurement he received his doctoral degree in 1983. Since 1985 he is with the University of Duisburg-Essen, engaged in analysis, measurement, simulation and control of bulk and decentralized power systems. In 1998 he was appointed as a professor. Gerhard Krost is member of CIGRE, IET, IEEE and VDE.
Louis Wehenkel (M’1993) received the electrical engineering (electronics) degree in 1986 and the Ph.D. degree in 1990, both from the University of Liège, Liège, Belgium. He is a full Professor of electrical engineering and computer science at the University of Liège. His research interests lie in the fields of stochastic methods for systems and modelling, machine learning, and data mining, with applications in power systems planning, operation and control, and bioinformatics.
![Fig. 1 Model of situation awareness corresponding to Endsley [6].](https://thumb-eu.123doks.com/thumbv2/123doknet/6178025.158876/2.918.469.850.375.600/fig-model-situation-awareness-corresponding-endsley.webp)
![Fig. 7 Application of the GNS for the incident on 4 th Nov. 2006 [2]](https://thumb-eu.123doks.com/thumbv2/123doknet/6178025.158876/6.918.471.842.184.408/fig-application-gns-incident-th-nov.webp)
