SUSTAINING DURABLE RURAL DEVELOPMENT THROUGH GOOD PRACTICE MODELS
SUSTINEREA DEZVOLTARII RURALE DURABILE PRIN INTERMEDIUL MODELELOR DE BUNA PRACTICA
C. PAVELIUC - OLARIU*
Rural Economy and Strategic Management are expected to support durable rural developmentin reducing the gap between the growth that major urban centres had over the last years and that of small rural comunities. In particular, Rural Development and Strategic Consultancy provide access to high quality information and to appropiate protocols. The present paper aims to present the importance of strategic planning in durable rural development and, also, the role of a good practice model in the development of a rural community. The good practice model presented here was created as an experimental model for a middle-sized rural village based on statistical data provided by the National Statistics Institute.
Key words:good practice model, rural development
INTRODUCTION
An increasing challenge in today`s rural development is to manage risks and to reduce the errors that occur in the ways that present rural planners develop the rural growth strategies. In order to reduce this errors, rural communities tend to adopt in our days development strategies already implemented elsewhere proven to be reliable and cost efficient. But sometimes these strategies can not be utilised somewhere else because of its individualisation for a certain community.
This is why good practice models appeared. A „good practice model” is an experimental model based on a successful project that can be adapted for use in all regions. Good practice models (GPM) provide access to high quality information that has been identified as being essential foor
* University of Agricultural Sciences and Veterinary Medicine “Ion Ionescu de la Brad” Iasi
good local governance. Better information would support the use of the best evidence and provide more accurate assesment of the quality of life in rural communities and the access of people to services. Moreover, GPM should provide ready access to appropiate knowledge and protocols that can be used for the development of rural infrastructure and the increase of services offered. They should also provide a rational aid to diagnosis or probable outcome on the basis of fesability socio-economic analysis.
DESCRIPTION OF THE EXPERIMENTAL MODEL (GPM) The “Hops Eco Farm Project for the Romanian beer industry” presents a good practice model that can be applied for further development of local rural communities. It represents the next step in ecological agriculture research and is based on the implementation of a minimal works system with no chemical treatments what so ever. The economic results obtained by our proposed experimental model show that the projects` feasibility is high with a great investment return rate, particularity worth considering when developing a business.
The size of the Hops Eco – Farm must be of, at least, 250 hectares and of a maximum of 500 hectares per farm (for better material and human resources management).
The breeds of hops that would be cultivated in the Hops Eco – Farm would be Northern Brewer as a semi – early breed, Brewers Gold, as a tardy breed. The time of plantation and the length of the vegetation period for these breeds are different so the production can be rationalized for the duration of the year.
The advantages of the Hops Eco – Farm project consists of that the hops cones don`t contain any chemical substances that usually are absorbed from fertilizers and the costs are down and the benefits are increasing due to the fact that the distances used for the installation schemes are reduced, the hops breeds used have different vegetation periods and soil works are on a minimal works system.
The existent competitors on the romanian market use the classic hops cultivation scheme with a single breed/ plantation, full soil works system and chemical fertilization scheme. The products offered in Romania by competitors are grown in classical scheme farms using chemical based products. The currently hops cultivated surface in Romania is of
approximately 250 hectares and the production is sold to the major beer manufacturers. With a production of 2 tons per hectare in a year, the total annual production is of approximately 500 tones.
FESABILITY STUDY OF THE PROPOSED EXPERIMENTAL MODEL (GPM)
The economic results obtained by the proposed experimental model show that the projects` feasibility is high with a great investment return rate, particularity worth considering when developing a business.
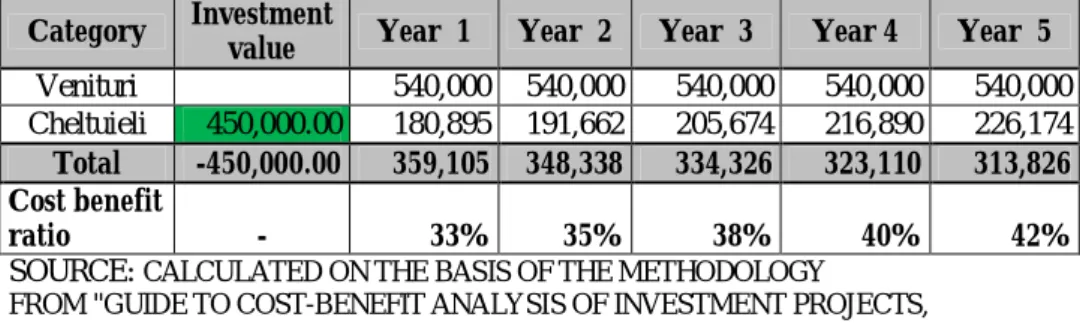
TABEL 1. THE PROJECTION OF THE INVESTMENT OPERATING COST OVER A 5 YEAR PERIOD
Category Investment
value Year 1 Year 2 Year 3 Year 4 Year 5
Venituri 540,000 540,000 540,000 540,000 540,000 Cheltuieli 450,000.00 180,895 191,662 205,674 216,890 226,174
Total -450,000.00 359,105 348,338 334,326 323,110 313,826 Cost benefit
ratio - 33% 35% 38% 40% 42%
SOURCE: CALCULATED ON THE BASIS OF THE METHODOLOGY FROM "GUIDE TO COST-BENEFIT ANALYSIS OF INVESTMENT PROJECTS, euro PEAN COMMSSION - DG REGIONAL POLICY , 2000"
TABLE 2.ECONOMIC PROJECTIONS OF THE GPM
Economic projections estimated over a 20
years Values
Updated values
Incomes 15,162,523 14,039,372.82
Expenses 5,731,263 5,306,724.54
Figure 1.The projection of investment operating costs over a 5 year period
As the projection of the operation costs shows,the internal rate of return for a 450.000 Euro investment is estimated at approximately 79% after a 5 year period and with a cost/benefit ratio of 0.026 for a 20 year period projection.
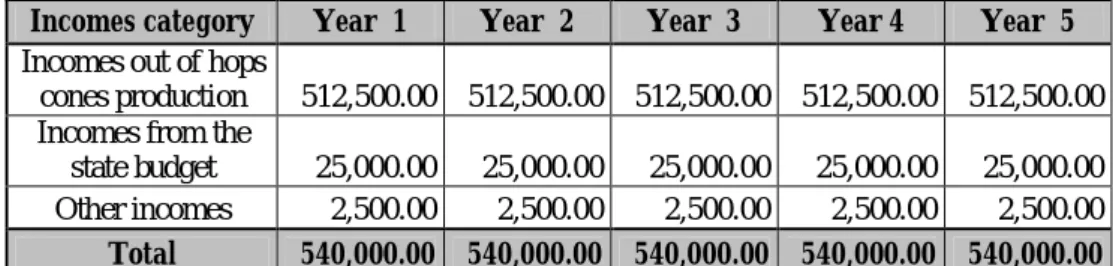
TABLE 3. THE PROJECTION OF INVESTMENT OPERATING INCOMES OVER A 5 YEAR PERIOD
Incomes category Year 1 Year 2 Year 3 Year 4 Year 5
Incomes out of hops
cones production 512,500.00 512,500.00 512,500.00 512,500.00 512,500.00 Incomes from the
state budget 25,000.00 25,000.00 25,000.00 25,000.00 25,000.00 Other incomes 2,500.00 2,500.00 2,500.00 2,500.00 2,500.00
Total 540,000.00 540,000.00 540,000.00 540,000.00 540,000.00 SOURCE: CALCULATED ON THE BASIS OF THE METHODOLOGY FROM "GUIDE TO COST-BENEFIT ANALYSIS OF INVESTMENT PROJECTS, Euro PEAN COMMSSION - DG REGIONAL POLICY, 2000"
The operating incomes registered over a 5 year period by the GPM present a constant level being of 540.000 Euro. Approximately 94,9% of the total incomes of the GPM are registered from the production activity, this being the main workforce consumer in the region, as shown in Table 3.
Figure 2.The projection of investment operating incomes over a 5 year period
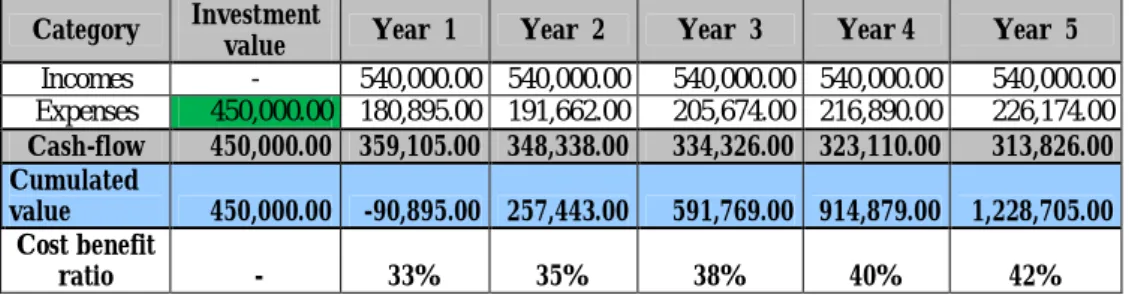
From the projection of the investment over a 5 year period, it reveals that the total cost/benefit ratio registers an increasing tendency, from 33% in year 1 to 42% in year 5 and with a cumulated value in year 5 of 1,228,705 Euro. The cash flow registers a decreasing tendency over the same 5 year period, as shown in Table 4.
TABLE 4.THE PROJECTION OF THE INVESTMENT OVER A 5 YEAR PERIOD
Category Investment
value Year 1 Year 2 Year 3 Year 4 Year 5
Incomes - 540,000.00 540,000.00 540,000.00 540,000.00 540,000.00 Expenses 450,000.00 180,895.00 191,662.00 205,674.00 216,890.00 226,174.00 Cash-flow 450,000.00 359,105.00 348,338.00 334,326.00 323,110.00 313,826.00 Cumulated value 450,000.00 -90,895.00 257,443.00 591,769.00 914,879.00 1,228,705.00 Cost benefit ratio - 33% 35% 38% 40% 42%
SOURCE: CALCULATED ON THE BASIS OF THE METHODOLOGY FROM "GUIDE TO COST-BENEFIT ANALYSIS OF INVESTMENT PROJECTS, euro PEAN COMMSSION - DG REGIONAL POLICY , 2000"
The economic projections made over a 20 year period for the GPM show a cost/benefit ratio of 0.378% for the NPV in year 20, as a total of the overall production activity.
TABLE 5. INVESTMENT ECONOMIC PROJECTIONS OF THE GPM
Economic projections estimated over 20
years Values Updated values
Incomes 15,162,522.65 14,039,372.82
Expenses 5,731,262.51 5,306,724.54
Cost benefit ratio 0.37799%
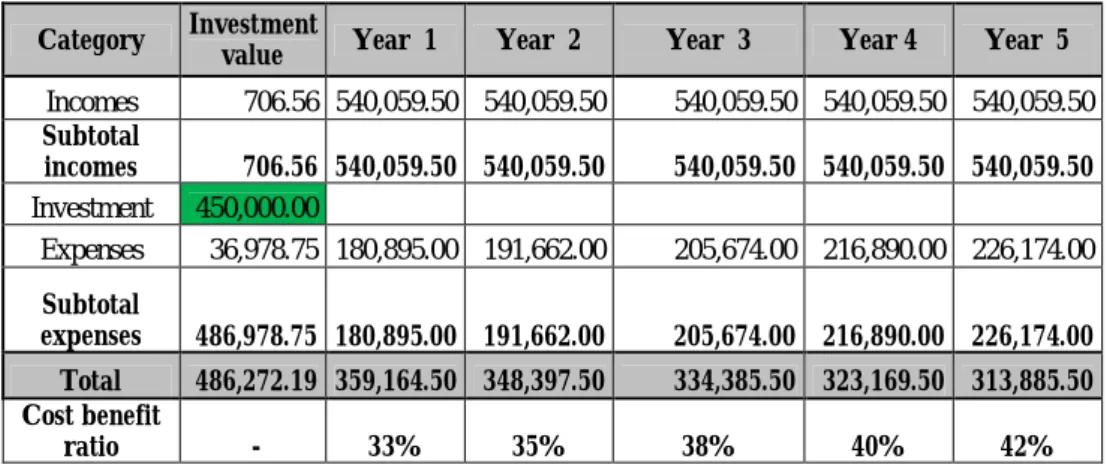
The socio-economic analysis of the investment proposed by this GPM presents the way the „good practice model” will affect the socio-economic environment through the proposed investments and, also, by the indirect investments that will be made in the local rural community after the implementation of the GPM. A short analysis of the GPM from a socio-economic point of view reveals that the investment costs will decrease yearly and cost/benefit ratio after adopting this experimental model will present a sequential growth.
The socio-economic analysis present a internal rate of return on the investment of approximately 73% that includes the benefits from incomes, workplaces created, new investments for the local community (and, indirectly, other benefits for the principal investment:better infrastructure, qualification of workforce, access to services).
TABLE 6. THE SOCIO-ECONOMIC ANALYSIS OF THE INVESTMENT
Category Investment
value Year 1 Year 2 Year 3 Year 4 Year 5
Incomes 706.56 540,059.50 540,059.50 540,059.50 540,059.50 540,059.50 Subtotal incomes 706.56 540,059.50 540,059.50 540,059.50 540,059.50 540,059.50 Investment 450,000.00 Expenses 36,978.75 180,895.00 191,662.00 205,674.00 216,890.00 226,174.00 Subtotal expenses 486,978.75 180,895.00 191,662.00 205,674.00 216,890.00 226,174.00 Total 486,272.19 359,164.50 348,397.50 334,385.50 323,169.50 313,885.50 Cost benefit ratio - 33% 35% 38% 40% 42%
SOURCE: CALCULATED ON THE BASIS OF THE METHODOLOGY FROM "GUIDE TO COST-BENEFIT ANALYSIS OF INVESTMENT PROJECTS, euro PEAN COMMSSION - DG REGIONAL POLICY , 2000"
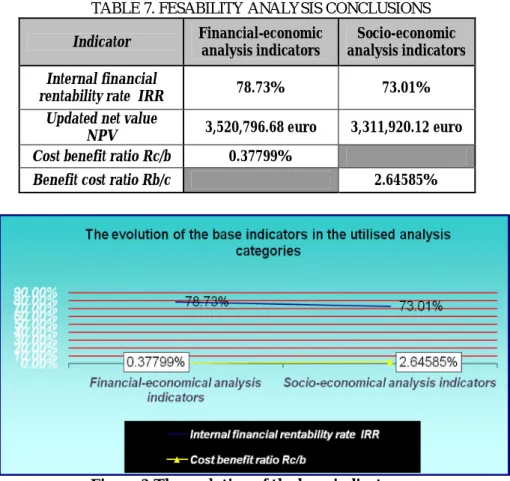
A Good Practice Model for Rural Development has the role to evaluate the needs of local communities and to find the appropiate ways through which a rural village can grow. The proposed experimental model to be used as a GPM:”The Hops Eco Farm Project” has revealed a IRR of 78.73% from the financial-economic analysis and 73.01% from the socio-economic analysis. The benefit cost/ratio presented by the socio-socio-economic analysis indicators of 2.646% presented an increased level of social atractivity for the model, fact that gives the GPM an assertive role in durable development.
TABLE 7. FESABILITY ANALYSIS CONCLUSIONS
Indicator Financial-economic
analysis indicators
Socio-economic analysis indicators Internal financial
rentability rate IRR 78.73% 73.01%
Updated net value
NPV 3,520,796.68 euro 3,311,920.12 euro
Cost benefit ratio Rc/b 0.37799%
Benefit cost ratio Rb/c 2.64585%
CONCLUSIONS
A GPM has the role of sustaining the rural communities in their efforts of durable development by creating the protocols and introducing a reduced risk environment that can help rural villages and their governance.
The „Hops Eco Farm Project” has been proposed as a „good practice model” because of its high return on investment rate (ROI) and due to the high internal rate of rentability(IRR) shown by the socio-economic analysis that reaches 73.01%.
Good Practice Model (GPM) have the role of reducing the gap in development present between urban and rural centers using high quality information with the purpose of decreasing the risks that are usually met be local governance in the implementation of rural development strategies.
BIBLIOGRAPHY
1. CECILIA TACOLI, 2003, The links between urban and rural development, Environment & Urbanization, vol.15, pag.1-10
2. KELLY PHILIP F, 1998, The politics of urban–rural relationships: land conversion in the Philippines, Environment and Urbanization, Vol. 10, No.1, pag. 35–54
3. LEACH, M., MEARNS, R. , SCOONES, I. ,1997, “Challenges to Community-Based Sustainable Development: Dynamics, Entitlements, Institutions”, IDS Bulletin, Vol. 26, No. 1, pag. 1-8 4. UNDP/UNCHS (HABITAT), 1995, “Rural-urban linkages: policy
guidelines for rural development”, paper prepared for the 23rd Meeting of the ACC Sub-committee on Rural Development, UNESCO Headquarters, Paris, 31 May-2 June, 1995.