RESEARCH
Tryptophan catabolism increases in breast
cancer patients compared to healthy controls
without affecting the cancer outcome
or response to chemotherapy
Concetta Elisa Onesti
1,2, François Boemer
3, Claire Josse
1,2*, Stephane Leduc
3, Vincent Bours
2,3and Guy Jerusalem
1,4Abstract
Background: Indoleamine 2,3-dioxygenase catalyzes the conversion of tryptophan to kynurenine, an
immunosup-pressive metabolite involved in T regulatory cell differentiation. Indoleamine 2,3-dioxygenase is expressed in many cancer types, including breast cancer. Here, we analyze kynurenine and tryptophan and their ratio in breast cancer patients and healthy controls.
Methods: Breast cancer patients and healthy controls were prospectively enrolled in our study. All subjects
under-went blood sample withdrawal at diagnosis or on the day of screening mammography for the healthy controls. Plas-matic kynurenine and tryptophan were determined on a TQ5500 tandem mass spectrometer after chromatographic separation.
Results: We enrolled 146 healthy controls and 202 women with stages I–III breast cancer of all subtypes. All patients
underwent surgery, 126 underwent neoadjuvant chemotherapy with 43 showing a pathological complete response, and 43 underwent adjuvant chemotherapy. We observed significantly higher plasmatic kynurenine, tryptophan and their ratio for the healthy controls compared to patients with breast cancer. We observed a lower plasmatic tryp-tophan and a higher kynurenine/tryptryp-tophan ratio in hormone receptor-negative patients compared to hormone receptor-positive cancers. Lobular cancers showed a lower ratio than any other histologies. Advanced cancers were associated with a lower tryptophan level and higher grades with an increased kynurenine/tryptophan ratio. Patho-logical complete response was associated with higher kynurenine values. The plasmatic kynurenine, tryptophan and kynurenine/tryptophan ratios were not predictive of survival.
Conclusions: The plasmatic kynurenine, tryptophan and kynurenine/tryptophan ratio could differentiate breast
cancer patients from healthy controls. The Kyn/Trp ratio and Trp also showed different values according to hormone receptor status, TNM stage, T grade and histology. These results suggest a rapid metabolism in breast cancer, but no associations with outcome or sensitivity to chemotherapy were observed.
Keywords: Indoleamine 2,3-dioxygenase, Kynurenine, Tryptophan, Kynurenine/tryptophan ratio, Immune system,
Breast cancer, Circulating biomarkers
© The Author(s) 2019. This article is distributed under the terms of the Creative Commons Attribution 4.0 International License (http://creat iveco mmons .org/licen ses/by/4.0/), which permits unrestricted use, distribution, and reproduction in any medium, provided you give appropriate credit to the original author(s) and the source, provide a link to the Creative Commons license, and indicate if changes were made. The Creative Commons Public Domain Dedication waiver (http://creat iveco mmons .org/ publi cdoma in/zero/1.0/) applies to the data made available in this article, unless otherwise stated.
Open Access
*Correspondence: [email protected]
1 Medical Oncology Department, Centre Hospitalier Universitaire Sart-Tilman, Liège, Belgium
Background
Tryptophan (Trp) catabolism is a known mechanism involved in immune system modulation and is widely studied in cancer. Trp is metabolized by indoleamine 2,3-dioxygenase (IDO), by its splice variant IDO2 and by tryptophan 2,3-dioxygenase (TDO) [1]. IDO2 expres-sion is narrower than IDO, and it is inactivated in a large percentage of the population due to some common poly-morphisms, namely, R248W, that reduces IDO activity in approximately 90% of individuals, and Y359, which completely abolishes its catalytic function [2]. TDO is expressed at high levels in the liver, where it regulates systemic Trp levels, and in the brain, where it is respon-sible for the production of neuroactive metabolites, such as kinurenic and quinolinic acid [3]. IDO seems to play a central role in maintaining immune tolerance. Previ-ous studies showed that IDO-deficient mPrevi-ouse models are more susceptible to autoimmune disease, while TDO-deficient mice showed only behavioral alterations [3, 4]. IDO expression is induced in response to some inflam-matory cytokines, such as interferon-γ (IFN-γ), acting as an endogenous mechanism able to control an excessive immune response [5]. IDO is expressed by several tumor types and is correlated with lower cytotoxic cells and higher T regulatory (Treg) cell infiltration at the tumor site, poorer outcome and resistance to treatment [6–16].
Trp depletion induces an arrest at the G1 phase of the cell cycle, blocking T-lymphocyte proliferation, and triggers a stress response mediated by the activation of the nonderepressible kinase GCN2 pathway, which is responsible for T-cell anergy and apoptosis [17]. When exposed to low Trp levels, dendritic cells (DC) acquire tolerogenic capacity. DC showed an upregulation of the immunoglobulin-like transcript 3 and 4 inhibitory recep-tors (ILT3 and ILT4) and a lower expression of costimula-tory molecules, such as CD40 and CD80 [18]. The high expression of ILT3 and ILT4 leads to the differentiation of CD4+CD25+Foxp3+ Treg cells [18]. Moreover, Trp catabolites, i.e. kynurenine (Kyn) and its downstream metabolites, acting through the activation of the aryl hydrocarbon receptor (AHR), are also responsible for Treg differentiation and in inhibition of T lymphocytes and natural killer (NK) cells [19, 20].
IDO is expressed in several tumor types, including breast cancer. A retrospective analysis conducted on 203 breast cancer patients showed that none of the tumor samples were negative for IDO staining in immuno-histochemistry [21]. Larger, node-positive and estro-gen receptor-positive (ER+) tumors were associated with higher IDO expression, while greater vascular-ized tumors showed lower IDO staining [21]. A greater CD8+ and CD11b+ cell infiltration was observed in low-IDO tumors, while Treg infiltration was not associated
with IDO expression in this report [21]. Another study reported a negative association between high stromal IDO and worse disease-free and metastasis-free survival in breast cancer [22].
The plasmatic Kyn/Trp ratio is commonly used as a surrogate indicator of IDO activity, even though it might be an imperfect reflection of the tumor Trp catabolism. Lyon and colleagues observed a higher plasmatic Kyn/ Trp ratio in patients affected by breast cancer compared to healthy controls, but not a statistically significant dif-ference in the plasmatic level of the two molecules [23]. Another more recent study showed significantly lower plasmatic Trp and Kyn levels in breast cancer patients than in healthy controls, mainly in estrogen receptor-negative (ER−) tumors and at an advanced tumor stage [24]. Tang and colleagues observed higher Kyn plasmatic levels in ER− compared to ER+ cancers [25]. Overall, the previously mentioned studies did not unequivocally iden-tify an association between tumor characteristics and the plasmatic Kyn, Trp and Kyn/Trp ratio, in addition to not showing an association with outcome, despite what was observed in other diseases [14–16].
In the present study, we analyzed the plasmatic levels of Trp, Kyn and their ratio in a large cohort of stage I– III breast cancer patients undergoing surgery ± neoadju-vant/adjuvant treatment and in healthy controls. The aim of our study was to identify differences in Kyn, Trp and the Kyn/Trp ratios in plasma between healthy and can-cerous women to analyze the association of these param-eters with outcome, their distribution according to tumor characteristics and their correlation with some tumor and patient characteristics.
Materials and methods
Patients selection
This was an observational prospective study in which stage I–III breast cancer patients treated with surgery with or without adjuvant/neoadjuvant treatment, radio-therapy and hormonal radio-therapy according to clinical practice at the University Hospital of Liège in Belgium between May 2011 and August 2017 were enrolled.
Healthy controls were enrolled between January and November 2014 at the University Hospital of Liège in Belgium before performing a screening mammography and were allocated to the control group after confirma-tion of the absence of breast disease.
For all breast cancer patients, the following data were collected: ER status, progesterone receptor (PgR) status, HER2 status, Ki67, TNM stage, tumor size, tumor grade, type of treatment, response to chemotherapy for patients who received neoadjuvant chemotherapy (NAC), dis-ease-free survival (DFS) and breast cancer-specific sur-vival (BCSS).
This study was conducted in accordance with the Dec-laration of Helsinki. The institutional ethics committee approved the protocols, and each patient or healthy con-trol signed informed consent before inclusion in the trial.
Sample collection and storage
Blood sample withdrawal into an EDTA tube was per-formed before receiving any treatment for breast cancer patients or before the day of the screening mammogra-phy for healthy controls. After two centrifugation steps for 10 min at 815g and for 10 min at 2500g at 4 °C, plasma was collected in aliquots and stored at − 80 °C without thawing cycles until the sample analysis.
Tryptophan and kynurenine determination
The plasmatic samples were used to determine the Kyn and Trp concentrations. After the step of protein precipi-tation with salicylic acid, the Kyn and Trp concentrations were determined on a TQ5500 tandem mass spectrom-eter after chromatographic separation. The values were calculated by the software Analyst, comparing the spec-trometer intensity with known concentrations of internal standards for Trp and Kyn. The final concentrations were expressed in μM/L. Each sample was tested in triplicate, and the mean value was used for the statistical analysis.
Statistical analysis
Statistical analyses and graphs were performed using IBM SPSS Statistic v24, MedCalc v19 and Prism v5 GraphPad software.
The co-primary end-points of our study were to assess the different distributions of plasmatic Kyn, Trp and the Kyn/Trp ratio in breast cancer (BC) patients compared to healthy controls (CTRL).
The secondary end-points were to identify the differ-ent distribution of plasmatic Kyn, Trp and the Kyn/Trp ratio according to patient and tumor characteristics (age, ER status, PgR status, HER2 status, Ki67, TNM stage, T stage, N stage, tumor grade, histology, subtype, lym-phovascular invasion, response to NAC and relapse in the whole cohort and according to the different BC sub-types), to test the correlation between plasmatic Kyn, Trp and the Kyn/Trp ratio with the continuous variables age, ER, PgR, Ki67 and size and to assess DFS and BCSS in patients with Kyn, Trp and the Kyn/Trp ratio low vs. high.
The Mann–Whitney U test and Kruskal–Wallis test were used to compare the distributions of circulating Kyn, Trp and their ratio according to the following vari-ables: cancer patients vs. healthy controls; age at diagno-sis higher or lower than the median value; ER status; PgR status; HER2 status; Ki67; TNM stage; T stage; N stage; tumor grade; histology; subtype; lymphovascular inva-sion; response to neoadjuvant chemotherapy (NAC) and
relapse. A post hoc Bonferroni test was performed for comparison by pairs for variables with multiple catego-ries. An alpha level of 0.05 was accepted for significant results.
Spearman test was performed to analyze the correla-tion between plasma Kyn and Trp and their ratio with the following continuous variables: age, ER%, PgR%, Ki67% and tumor size in mm. An alpha level of 0.05 was accepted for significant results.
The median values of circulating Kyn, Trp and the Kyn/ Trp ratio for cancer patients were calculated and used as cut-offs to classify patients into two groups for each variable. Kaplan–Meier curves for DFS and BCSS were drafted, and the statistical significance was tested by means of a log-rank test, with an accepted alpha level of 0.05. The 5-year DFS and the 5-year BCSS were calcu-lated from the survival tables. The Cox Regression Haz-ard model was used to calculate the HR for both DFS and BCSS.
Results
In total, 348 subjects, 146 of whom were healthy controls (CTRL) and 202 of whom were stage I–III breast cancer (BC) patients, were enrolled in this study between May 2011 and August 2017 at the University Hospital of Liège in Belgium.
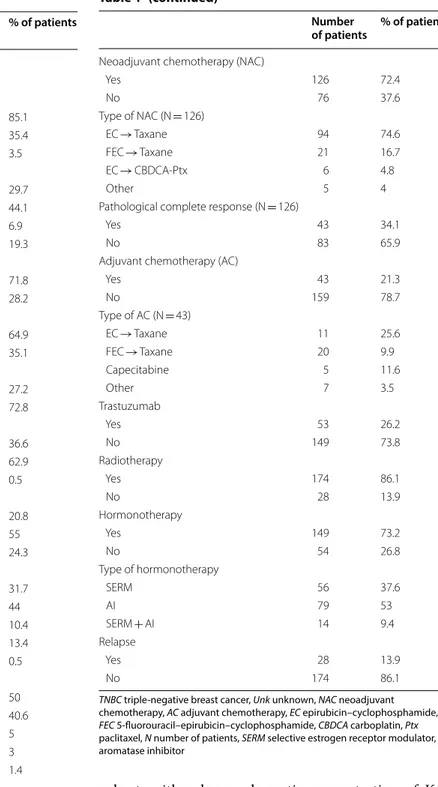
The median age for the whole cohort was 54.5 years (range 26–86). In particular, the median age in the group of 202 breast cancer patients was 56 years old (range 26–86), while the median age in the healthy controls group was 53 years old (range 40–74). The median fol-low-up was 60 months (range 14–96). The patients were classified as stage I in 20.8%, stage II in 55% and stage III in 24.3% of the cases. All the breast cancer subtypes were included in the study: Luminal A in 29.7%; Luminal B in 44.1%; HER2-enriched in 6.9% and triple-negative breast cancer (TNBC) in 19.3% of the cases. All patients under-went surgery and received neoadjuvant/adjuvant chemo-therapy, trastuzumab, radiotherapy and hormonotherapy according to cancer characteristics and physician choice. All patient characteristics and treatment details are sum-marized in Table 1.
Circulating Kyn was significantly lower in the BC patients than in the healthy CTRLs, with a median value of 1.770 ± 0.537 μM/L vs. 1.951 ± 0.708 μM/L (p < 0.0001), respectively. The same observation was found for the Trp value in plasma, which was 44.56 ± 10.83 μM/L and 48.80 ± 14.16 μM/L in the BCs and CTRLs respectively (p 0.001), and for the plasmatic Kyn/Trp ratio, which was 0.038 ± 0.013 for the BC patients and 0.042 ± 0.019 for the healthy CTRLs (p 0.026) (Table 2 and Fig. 1).
The Kyn and Kyn/Trp ratio in plasma showed a dif-ferent distribution according to age in the entire
cohort, with a lower plasmatic concentration of Kyn (1.738 ± 0.609 μM/L vs. 1.980 ± 0.643 μM/L, p < 0.0001) and Kyn/Trp ratio (0.036 ± 0.015 vs. 0.043 ± 0.016, p < 0.0001) for patients younger than 54.5 years (Table 2). Consistently, we observed a significant posi-tive correlation between the age and circulating Kyn or Kyn/Trp ratio, with correlation coefficients of 0.295 (p < 0.0001) and 0.300 (p < 0.0001), respectively (Table 3
and Additional file 1: Figure S3).
Table 1 Patient baseline characteristics Number
of patients % of patients
Median age: 56 years Range: 26–86 years Histology Ductal carcinoma 172 85.1 Lobular carcinoma 23 35.4 Other 7 3.5 Subtype Luminal A 60 29.7 Luminal B 89 44.1 HER2-enriched 14 6.9 TNBC 39 19.3 ER status Positive 145 71.8 Negative 57 28.2 PgR status Positive 131 64.9 Negative 71 35.1 HER2 status Positive 55 27.2 Negative 147 72.8 Ki67 < 20% 74 36.6 ≥ 20% 127 62.9 Unk 1 0.5 Stage I 42 20.8 II 111 55 III 49 24.3 T stage 1 64 31.7 2 89 44 3 21 10.4 4 27 13.4 Unk 1 0.5 N stage 0 101 50 1 82 40.6 2 10 5 3 6 3 Unk 3 1.4 Tumor grade G1 5 2.5 G2 100 49.5 G3 91 45 Unk 6 3 Lymphovascular invasion Yes 41 20.3 No 156 77.2 Unk 5 2.5 Table 1 (continued) Number of patients % of patients
Neoadjuvant chemotherapy (NAC)
Yes 126 72.4 No 76 37.6 Type of NAC (N = 126) EC → Taxane 94 74.6 FEC → Taxane 21 16.7 EC → CBDCA-Ptx 6 4.8 Other 5 4
Pathological complete response (N = 126)
Yes 43 34.1
No 83 65.9
Adjuvant chemotherapy (AC)
Yes 43 21.3 No 159 78.7 Type of AC (N = 43) EC → Taxane 11 25.6 FEC → Taxane 20 9.9 Capecitabine 5 11.6 Other 7 3.5 Trastuzumab Yes 53 26.2 No 149 73.8 Radiotherapy Yes 174 86.1 No 28 13.9 Hormonotherapy Yes 149 73.2 No 54 26.8 Type of hormonotherapy SERM 56 37.6 AI 79 53 SERM + AI 14 9.4 Relapse Yes 28 13.9 No 174 86.1
TNBC triple-negative breast cancer, Unk unknown, NAC neoadjuvant
chemotherapy, AC adjuvant chemotherapy, EC epirubicin–cyclophosphamide,
FEC 5-fluorouracil–epirubicin–cyclophosphamide, CBDCA carboplatin, Ptx
paclitaxel, N number of patients, SERM selective estrogen receptor modulator, AI aromatase inhibitor
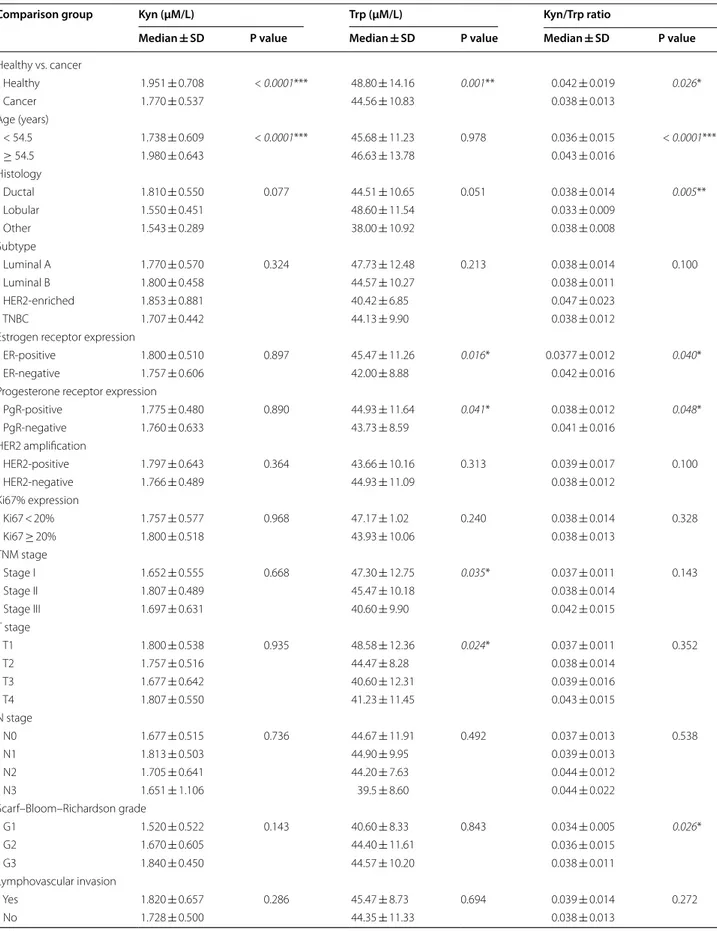
Table 2 Kyn, Trp and Kyn/Trp ratio according to patient and tumor characteristics
Comparison group Kyn (μM/L) Trp (μM/L) Kyn/Trp ratio
Median ± SD P value Median ± SD P value Median ± SD P value
Healthy vs. cancer Healthy 1.951 ± 0.708 < 0.0001*** 48.80 ± 14.16 0.001** 0.042 ± 0.019 0.026* Cancer 1.770 ± 0.537 44.56 ± 10.83 0.038 ± 0.013 Age (years) < 54.5 1.738 ± 0.609 < 0.0001*** 45.68 ± 11.23 0.978 0.036 ± 0.015 < 0.0001*** ≥ 54.5 1.980 ± 0.643 46.63 ± 13.78 0.043 ± 0.016 Histology Ductal 1.810 ± 0.550 0.077 44.51 ± 10.65 0.051 0.038 ± 0.014 0.005** Lobular 1.550 ± 0.451 48.60 ± 11.54 0.033 ± 0.009 Other 1.543 ± 0.289 38.00 ± 10.92 0.038 ± 0.008 Subtype Luminal A 1.770 ± 0.570 0.324 47.73 ± 12.48 0.213 0.038 ± 0.014 0.100 Luminal B 1.800 ± 0.458 44.57 ± 10.27 0.038 ± 0.011 HER2-enriched 1.853 ± 0.881 40.42 ± 6.85 0.047 ± 0.023 TNBC 1.707 ± 0.442 44.13 ± 9.90 0.038 ± 0.012
Estrogen receptor expression
ER-positive 1.800 ± 0.510 0.897 45.47 ± 11.26 0.016* 0.0377 ± 0.012 0.040*
ER-negative 1.757 ± 0.606 42.00 ± 8.88 0.042 ± 0.016
Progesterone receptor expression
PgR-positive 1.775 ± 0.480 0.890 44.93 ± 11.64 0.041* 0.038 ± 0.012 0.048* PgR-negative 1.760 ± 0.633 43.73 ± 8.59 0.041 ± 0.016 HER2 amplification HER2-positive 1.797 ± 0.643 0.364 43.66 ± 10.16 0.313 0.039 ± 0.017 0.100 HER2-negative 1.766 ± 0.489 44.93 ± 11.09 0.038 ± 0.012 Ki67% expression Ki67 < 20% 1.757 ± 0.577 0.968 47.17 ± 1.02 0.240 0.038 ± 0.014 0.328 Ki67 ≥ 20% 1.800 ± 0.518 43.93 ± 10.06 0.038 ± 0.013 TNM stage Stage I 1.652 ± 0.555 0.668 47.30 ± 12.75 0.035* 0.037 ± 0.011 0.143 Stage II 1.807 ± 0.489 45.47 ± 10.18 0.038 ± 0.014 Stage III 1.697 ± 0.631 40.60 ± 9.90 0.042 ± 0.015 T stage T1 1.800 ± 0.538 0.935 48.58 ± 12.36 0.024* 0.037 ± 0.011 0.352 T2 1.757 ± 0.516 44.47 ± 8.28 0.038 ± 0.014 T3 1.677 ± 0.642 40.60 ± 12.31 0.039 ± 0.016 T4 1.807 ± 0.550 41.23 ± 11.45 0.043 ± 0.015 N stage N0 1.677 ± 0.515 0.736 44.67 ± 11.91 0.492 0.037 ± 0.013 0.538 N1 1.813 ± 0.503 44.90 ± 9.95 0.039 ± 0.013 N2 1.705 ± 0.641 44.20 ± 7.63 0.044 ± 0.012 N3 1.651 ± 1.106 39.5 ± 8.60 0.044 ± 0.022 Scarf–Bloom–Richardson grade G1 1.520 ± 0.522 0.143 40.60 ± 8.33 0.843 0.034 ± 0.005 0.026* G2 1.670 ± 0.605 44.40 ± 11.61 0.036 ± 0.015 G3 1.840 ± 0.450 44.57 ± 10.20 0.038 ± 0.011 Lymphovascular invasion Yes 1.820 ± 0.657 0.286 45.47 ± 8.73 0.694 0.039 ± 0.014 0.272 No 1.728 ± 0.500 44.35 ± 11.33 0.038 ± 0.013
In the cohort of cancerous patients, a statisti-cally significant lower Trp level and higher Kyn/Trp ratio in plasma were observed for the ER− and PgR− patients compared to ER+ and PgR+ patients, respec-tively (Table 2). In particular, the values of circulating Trp were 42.00 ± 8.88 μM/L vs. 45.47 ± 11.26 μM/L (p 0.016) in ER− vs. ER+ and 43.73 ± 8.59 μM/L vs. 44.93 ± 11.64 μM/L (p 0.041) in PgR− and PgR+, respectively. The values of the plasmatic Kyn/Trp ratio were 0.042 ± 0.016 in ER− vs. 0.0377 ± 0.012 in ER+ patients (p 0.040) and 0.041 ± 0.016 in PgR− vs. 0.038 ± 0.012 in PgR+ patients (p 0.048). The correla-tion analysis showed a positive correlacorrela-tion between ER% and circulating Trp level and a negative correla-tion between PgR% and the Kyn/Trp ratio in plasma, as reported in Table 3 and in Additional file 1: Figure S3.
A lower plasmatic Kyn/Trp ratio for lobular carcino-mas compared to the other histologies was also detected, particularly with a ratio of 0.033 ± 0.009 for lobular,
0.038 ± 0.014 for ductal and 0.038 ± 0.008 for other his-tologies (p 0.005). A comparison by pairs confirmed the difference between ductal and lobular carcinoma with a p value of 0.011 (Additional file 1: Table S1).
Moreover, the plasmatic Kyn/Trp ratio showed pro-gressively higher values with increasing tumor grade, particularly 0.034 ± 0.005 for G1, 0.036 ± 0.015 for G2 and 0.038 ± 0.011 for G3 (p 0.026). The comparison by pairs did not confirm this difference (Additional file 1: Table S6), probably due to the low number of patients classified as G1.
We also observed a progressively lower circulat-ing Trp level accordcirculat-ing to the increase of T (from 48.58 ± 12.36 μM/L in T1 to 41.23 ± 11.45 μM/L in T4, p 0.024) and TNM stage (from 47.30 ± 12.75 μM/L for Stage I to 40.60 ± 9.90 μM/L for Stage III, p 0.035). In particular, plasmatic Trp showed a significantly differ-ent distribution in the T1 tumor compared to T2-4 (p 0.003) and in Stage I compared to Stage II–III (p 0.014),
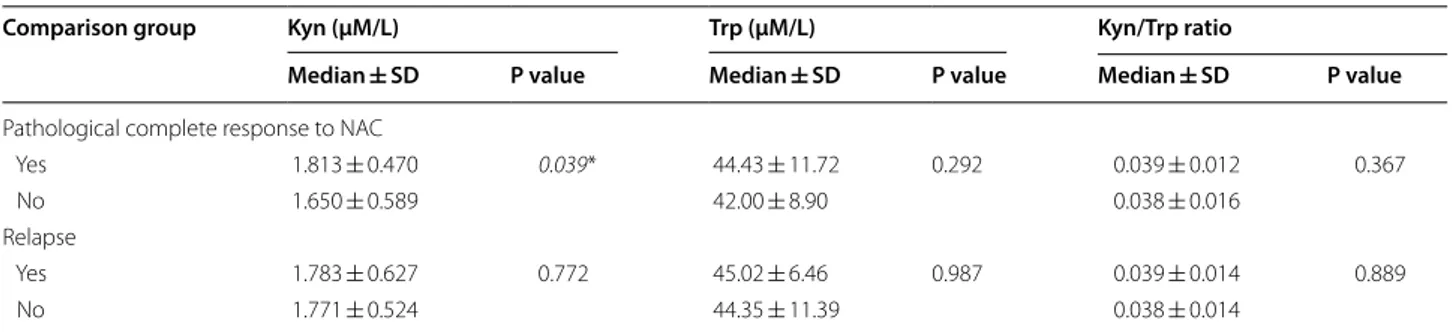
Table 2 (continued)
Comparison group Kyn (μM/L) Trp (μM/L) Kyn/Trp ratio
Median ± SD P value Median ± SD P value Median ± SD P value
Pathological complete response to NAC
Yes 1.813 ± 0.470 0.039* 44.43 ± 11.72 0.292 0.039 ± 0.012 0.367
No 1.650 ± 0.589 42.00 ± 8.90 0.038 ± 0.016
Relapse
Yes 1.783 ± 0.627 0.772 45.02 ± 6.46 0.987 0.039 ± 0.014 0.889
No 1.771 ± 0.524 44.35 ± 11.39 0.038 ± 0.014
The corresponding p values for patients showing or not a pCR and for patients with or without relapse are reported in the table. A significance level of 0.05 is accepted (in italics)
Median value of Kyn, Trp and Kyn/Trp ratio according to patient and tumor characteristics, to response to chemotherapy and relapse. The p value was calculated as the mean of the Mann–Whitney U test for two variables or the Kruskal–Wallis test for three or more variables
Kyn kynurenine, Trp tryptophan, SD standard deviation, TNBC triple-negative breast cancer, ER estrogen receptor, NAC neoadjuvant chemotherapy
Fig. 1 Scatter dot plots representing the differences in median value between breast cancer patients and healthy controls for Kyn (a), Trp (b) and
according to the Mann–Whitney U test. The compari-son by pairs showed a statistically significant difference between T1 and T2 and between Stage I and Stage III (Additional file 1: Tables S3, S4). Likewise, a negative cor-relation between the plasmatic Trp level and tumor size expressed in mm was observed (Table 3 and Additional file 1: Figure S3).
For all the other variables (BC subtype, HER2 expres-sion, ki67 expresexpres-sion, N stage and lympho-vascular invasion), we did not observe any differences in circu-lating Kyn, Trp and the Kyn/Trp ratio distribution, as shown in Table 2 and in Additional file 1: Tables S1–S6.
In addition to the association of plasmatic Kyn, Trp and the Kyn/Trp ratio with cancer characteristics, we also analyzed their predictive roles in the response
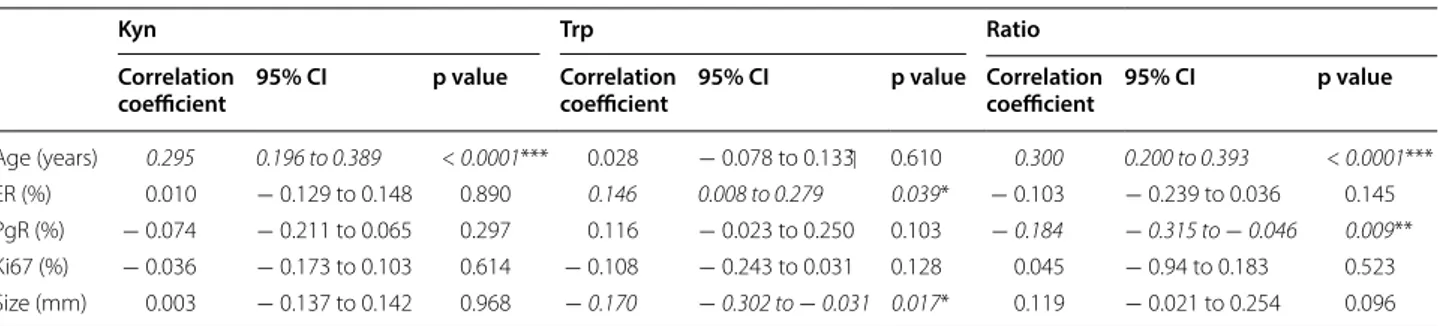
Table 3 Correlation of Kyn, Trp and Kyn/Trp ratio with the continuous variables age, ER, PgR, Ki67 and size
The correlation was calculated with the Spearman test. The correlation coefficient, 95% CI and p value are reported in the table. The significant correlations are reported in italics
CI confidence interval, ER estrogen receptor, PgR progesterone receptor
Kyn Trp Ratio
Correlation
coefficient 95% CI p value Correlation coefficient 95% CI p value Correlation coefficient 95% CI p value
Age (years) 0.295 0.196 to 0.389 < 0.0001*** 0.028 − 0.078 to 0.133 0.610 0.300 0.200 to 0.393 < 0.0001***
ER (%) 0.010 − 0.129 to 0.148 0.890 0.146 0.008 to 0.279 0.039* − 0.103 − 0.239 to 0.036 0.145 PgR (%) − 0.074 − 0.211 to 0.065 0.297 0.116 − 0.023 to 0.250 0.103 − 0.184 − 0.315 to − 0.046 0.009**
Ki67 (%) − 0.036 − 0.173 to 0.103 0.614 − 0.108 − 0.243 to 0.031 0.128 0.045 − 0.94 to 0.183 0.523 Size (mm) 0.003 − 0.137 to 0.142 0.968 − 0.170 − 0.302 to − 0.031 0.017* 0.119 − 0.021 to 0.254 0.096
Table 4 Kyn, Trp and Kyn/Trp ratio in breast cancer subtypes
The corresponding p values for patients showing or not a pCR and for patients with or without relapse are reported in the table. A significance level of 0.05 is accepted (in italics)
Median value of Kyn, Trp and Kyn/Trp ratio in the different breast cancer subtypes according to the response to chemotherapy and relapse tested by the mean of the Mann–Whitney U test
Kyn kynurenine, Trp tryptophan, SD standard deviation, PCR pathological complete response, TNBC triple-negative breast cancer
Group (N of pts) Kyn Trp Kyn/Trp ratio
Median ± SD p value Median ± SD p value Median ± SD p value
Luminal A (60 pts) PCR (0) NA NA NA NA NA NA No pCR (13) 1.710 ± 0.684 NA 36.70 ± 8.26 NA 0.042 ± 0.019 NA No relapse (53) 1.775 ± 0.582 0.982 48.17 ± 13.02 0.442 0.038 ± 0.014 0.542 Relapse (7) 1.717 ± 0.501 44.67 ± 5.88 0.043 ± 0.009 Luminal B (89 pts) PCR (23) 1.887 ± 0.327 0.001** 44.77 ± 14.17 0.455 0.045 ± 0.011 0.029* No pCR (42) 1.580 ± 0.463 43.47 ± 8.51 0.036 ± 0.011 No relapse (79) 1.807 ± 0.463 0.194 43.87 ± 10.53 0.447 0.038 ± 0.011 0.119 Relapse (10) 1.653 ± 0.389 46.93 ± 8.42 0.035 ± 0.006 HER2-enriched (14 pts) PCR (7) 1.757 ± 0.790 0.234 39.73 ± 8.12 0.836 0.045 ± 0.018 0.295 No pCR (6) 2.43 ± 0.956 42.42 ± 5.03 0.063 ± 0.028 No relapse (10) 1.828 ± 0.786 0.454 37.80 ± 6.67 0.076 0.047 ± 0.023 1 Relapse (4) 2.398 ± 1.135 46.13 ± 2.94 0.049 ± 0.026 TNBC (39 pts) PCR (13) 1.707 ± 0.476 0.853 44.43 ± 7.98 0.511 0.037 ± 0.008 0.353 No pCR (22) 1.777 ± 0.449 41.97 ± 10.87 0.042 ± 0.013 No relapse (39) 1.648 ± 0.450 0.707 44.78 ± 10.73 0.440 0.037 ± 0.012 0.761 Relapse (7) 1.813 ± 0.437 42.00 ± 4.65 0.042 ± 0.011
to chemotherapy and cancer relapse (Table 2). We observed a statistically significant higher circulating Kyn level for patients experiencing a pathological com-plete response (pCR) after NAC in 126 patients, with a value of 1.813 ± 0.470 μM/L vs. 1.650 ± 0.589 μM/L (p 0.039), but no differences in plasmatic Trp or the Kyn/ Trp ratio were detected. Considering the different breast cancer subtypes, we detected a higher plasmatic Kyn (1.887 ± 0.327 μM/L vs. 1.580 ± 0.463 μM/L, p 0.001) and Kyn/Trp ratio (0.045 ± 0.011 vs. 0.036 ± 0.011, p 0.029) for Luminal B patients who reached a pCR com-pared with patients with residual disease, but not sig-nificant association for the other subtypes (Table 4). No significant difference was detected in the four sub-types between patients experiencing a relapse and those not (Table 4). Interestingly, we observed a higher Kyn median value, a lower Trp and a higher Kyn/Trp ratio in plasma in TNBC with residual disease and in patients who relapsed, even if the significance level was not reached.
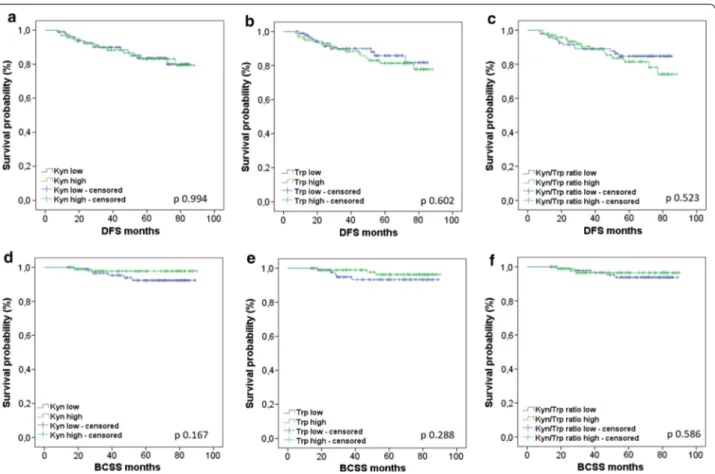
We classified BC patients into different groups accord-ing to circulataccord-ing Kyn, Trp and the Kyn/Trp levels usaccord-ing the median value in the cancerous patients as the thresh-old: 1.77 μM/L for Kyn, 44.56 μM/L for Trp and 0.038 for the Kyn/Trp ratio. We analyzed DFS and BCSS in these groups. Six patients of 202 of the BC cohort were not evaluable for survival due to deaths from other causes or loss during follow-up. Among the 196 patients included in the analysis for survival, we detected 28 progressions and 8 deaths. We detected a non statistically significant difference in DFS in the groups with low and high plas-matic Kyn/Trp ratio (Fig. 2c), with a 5-year DFS of 85% vs. 73% (p 0.523), respectively. For all the other vari-ables (low and high circulating kyn and Trp), we did not observe any difference in the groups analyzed (Fig. 2 and Table 5).
The analysis of DFS and BCSS in the different BC sub-types according to circulating Kyn, Trp and the Kyn/Trp ratio did not show significant results (Additional file 1: Figures S1, S2).
Fig. 2 Kaplan–Meier curves for DFS according to Kyn (a), Trp (b) and the Kyn/Trp ratio (c) and for BCSS according to Kyn (d), Trp (e) and the Kyn/Trp
ratio (f). The cohort was divided into Kyn low and high groups, Trp low and high groups and Kyn/Trp ratio low and high groups, using the median respective value for the cohort affected by breast cancer as a threshold. The statistical significance was calculated by means of a log-rank test for each curve, and the corresponding p values are reported in the figure
Discussion
In this study, we analyzed Kyn and Trp levels and their ratios in the plasma of early BC patients and healthy CTRLs. To our knowledge, this is the largest study evalu-ating the plasmatic level of Trp and its metabolite Kyn in this setting of patients. The aim of our study was to iden-tify a difference in circulating Kyn, Trp and the Kyn/Trp level in the presence of a BC, according to BC character-istics and their predictive role on survival, as observed in other malignancies.
We met our primary objective to demonstrate the dif-ference in plasmatic Kyn, Trp and the Kyn/Trp ratio between BC patients and healthy CTRLs. Overall, we observed lower Kyn and Trp levels in plasma of can-cerous patients, suggesting rapid Trp catabolism, with a possible accumulation of downstream metabolites, such as quinolinic and kynurenic acid. The same results were shown by Greene and colleagues in a cohort of 77 BC patients compared to 40 healthy CTRLs [24]. These authors also analyzed the plasma level of nicotinamide, the final metabolite of Trp catabolism. They observed an accumulation of nicotinamide relative to the Trp level in plasma of BC patients, which suggests hyperactivation of the catabolic pathway [24]. In our study, we also found a higher plasmatic Kyn/Trp ratio in healthy CTRLs than in BC patients. These results are not consistent with those shown in a previously published study by Lyon and col-leagues, but we note that the sample in this paper com-prised only 57 subjects vs. 348 in our study [23]. Our finding of a lower Kyn/Trp ratio in BC concomitant to lower Kyn and Trp levels in plasma suggests a major decrease in Kyn vs. Trp in the presence of cancer, prob-ably due to the hyperactivation of other downstream enzymes, such as kynureninase (KYNU) and kynure-nine hydroxylase. This is consistent with the results of D’Amato and colleagues, who observed an upregulation
not only of TDO but also of KYNU in TNBC cell lines [26].
In our study, we observed a higher plasmatic Kyn and Kyn/Trp ratio in older women. This result is consistent with literature data showing an increase in tryptophan metabolism with age, which is known to be associated with central nervous system degenerative diseases [27]. Analogously, an accumulation of Kyn and other Trp products in serum was also observed in aging mice [28].
Hormone receptor (HR) status is also related to Trp catabolism, as already shown in the literature, with an upregulation of TDO in an NF-κB-dependent manner in HR- breast cancer cell lines [26]. This is consistent with our finding of a lower circulating Trp level concomitant with a higher Kyn/Trp ratio in HR− tumors. Considering the known immunosuppressive role of Kyn and the fact that HR− BCs are associated with a higher immune infil-tration, we could not associate the difference in immune system activation throughout breast cancer subtypes with the plasmatic Kyn/Trp ratio. In fact, plasmatic Kyn and Trp levels reflect the systemic Trp catabolism and could not be considered a reflection of tumor microen-vironment, in which the local enzymatic activity deter-mines the level of metabolites at tumor site.
In stage I tumors compared to Stage II and III tumors and in T1 tumors compared to T2-4 tumors, we observed a higher plasmatic Trp level, suggesting faster Trp degra-dation in larger tumors.
In the whole cohort of patients receiving NAC, we observed a higher level of circulating Kyn in patients experiencing a pCR without any statistically significant difference in Trp level or in the Kyn/Trp ratio in plasma, while in the Luminal B subtype only, the high Kyn level for patients with pCR was concomitant with a signifi-cant increase in the Kyn/Trp ratio in plasma samples. This is in contrast with what was expected, consider-ing the immunosuppressive role of Kyn and the known
Table 5 DFS and BCSS according to Kyn, Trp and the Kyn/Trp ratio
Kyn kynurenine, Trp tryptophan, DFS disease-free survival, N number, HR hazard ratio, BCSS breast cancer-specific survival
Outcome Parameter Kyn Trp Kyn/Trp ratio
Low High p value Low High p value Low High p value
DFS N patients 100 96 NA 95 101 NA 98 98 NA N events 14 14 NA 11 17 NA 13 15 NA 5-year-DFS 80% 79% 0.994 81% 78% 0.602 85% 73% 0.523 HR (95% CI) 1.003 (0.477–2.106) 1.224 (0.572–2.616) 1.273 (0.605–2.679) BCSS N patients 94 94 NA 90 98 NA 93 95 NA N events 6 2 NA 5 3 NA 5 3 NA 5-year-BCSS 92% 98% 0.167 94% 96% 0.288 94% 97% 0.586 HR (95% CI) 0.341 (0.069–1.691) 0.469 (0.112–1.964) 0.673 (0.161–2.822)
association of pCR with TIL infiltration [29, 30]. In addi-tion, in TNBC with residual disease and with relapse, it is interesting to observe a higher Kyn median value, a lower Trp and a higher Kyn/Trp ratio. However, the TNBC subgroup of our cohort comprised only 39 patients, and these results did not reach significance. Nevertheless, this study analyzes only Trp and its metabolites in plasma, and we cannot exclude a role for Trp catabolism in the tumor microenvironment.
Finally, we did not observe any association between plasmatic Kyn, Trp or their ratio with survival, in con-trast to what was observed for other cancer types. In fact, previously published studies showed a significant asso-ciation between a low Kyn/Trp ratio in plasma and longer survival in non-small cell lung cancer (NSCLC) treated with chemoradiation [14, 15] or immunotherapy [16].
The present study is the largest analyzing plasmatic Kyn and Trp levels in BC and in healthy CTRLs. This high number of patients allows us to compare the plas-matic concentrations of these metabolites between breast cancer subtypes, disease stage, proliferation marker expression, tumor grade, clinical outcome and response to chemotherapy. In no other previous studies the Trp and Kyn levels were so well described accord-ing to tumor characteristics, probably due to the small-est sample size. The plasmatic Trp level could be related to fasting, that is a missing information in our cohort. In the second instance, we did not measure the circulating downstream metabolites after Kyn, which could be use-ful for better understanding the variations in Trp catab-olism at any level of the pathway. Moreover, we have to take into account that other enzymes are involved in Trp catabolism, as well the metabolic pathway at the tumor level could be different from systemic catabolism and not necessarily reflected in circulating metabolite-level modification. Consequently, we cannot consider plas-matic Kyn and Trp levels as a direct reflection of IDO activity in tumor tissue. An analysis of the tumor site in addition to the plasmatic measurement of Trp and its metabolites could be useful to clarify the correspond-ence between the circulating and tumor compartments. Finally, a longer follow-up could be useful for the survival analysis. In our cohort, we observed only 28 events of progression and 8 of death out of 196 patients evaluated for outcome, which did not allow us to obtain conclusive results regarding survival.
Conclusions
In our study, we showed that plasmatic levels of Kyn, Trp and the Kyn/Trp ratio could differentiate BC patients from healthy CTRLs, but they were not useful for predicting the outcome or sensitivity to chemotherapy. According to
the above observations, breast cancer is associated with rapid metabolism that could be systemic or local.
Additional file
Additional file 1: Table S1. Comparison by pairs of Kyn, Trp and Kyn/ Trp distributions according to histology. Table S2. Comparison by pairs of Kyn, Trp and Kyn/Trp distributions according to breast cancer subtype. Table S3. Comparison by pairs of Kyn, Trp and Kyn/Trp distributions according to tumor stage. Table S4. Comparison by pairs of Kyn, Trp and Kyn/Trp distributions according to T stage. Table S5. Comparison by pairs of Kyn, Trp and Kyn/Trp distributions according to N stage. Table S6. Com-parison by pairs of Kyn, Trp and Kyn/Trp distributions according to Scarf– Bloom–Richardson tumor grade. Figure S1. Forest plot for DFS according to the 4 breast cancer subtypes and for Kyn, Trp and the Kyn/Trp ratio. Figure S2. Forest plot for BCSS according to the 4 breast cancer subtypes and for Kyn, Trp and the Kyn/Trp ratio. Figure S3. Correlation graphs for Kyn, Trp and the Kyn/Trp ratio with age, ER, PgR, Ki67 and size.
Abbreviations
AHR: aryl hydrocarbon receptor; BCSS: breast cancer specific survival; CTRL: control; DC: dendritic cell; DFS: disease free survival; ER: estrogen receptor; HR: hormone receptor; IDO: indoleamine 2,3-dioxygenase; ILT3: immunoglobulin-like transcript 3; ILT4: immunoglobulin-immunoglobulin-like transcript 4; Kyn: kynurenine; KYNU: kynureninase; NAC: neoadjuvant chemotherapy; PCR (or pCR): pathological complete response; PgR: progesterone receptor; TDO: tryptophan 2,3-dioxy-genase; TNBC: triple negative breast cancer; Treg: T regulatory; Trp: tryptophan. Acknowledgements
We acknowledge the Institutional Biobank (BHUL–Université de Liège–CHU de Liège, Belgium).
Authors’ contributions
CEO: study design, sample analysis, data collection, statistical analysis, manu-script writing. FB: study design, sample analysis, manumanu-script revision. CJ: study design, statistical analysis, manuscript revision. SL: sample analysis. VB: study design, manuscript revision. GJ: study design, manuscript revision. All authors read and approved the final manuscript.
Funding
This work was supported by the Belgian Fund for Scientific Research (F.R.S.-FNRS), Fondation contre le cancer, FIRS CHU Liege and Fondation Léon Fredericq.
Availability of data and materials
The datasets used and/or analyzed during the current study are available from the corresponding author upon reasonable request.
Ethics approval and consent to participate
This study was conducted in accordance with the Declaration of Helsinki. The institutional ethics committee of the University Hospital of Liège (Belgium) approved the protocols under the following committee’s reference numbers: 2010/252; 2013/214 and 2013/215.
Consent for publication
Each patient or healthy control signed informed consent before inclusion in the trial, including acceptance for data publication.
Competing interests
The authors declare that they have no competing interests. Author details
1 Medical Oncology Department, Centre Hospitalier Universitaire Sart-Tilman, Liège, Belgium. 2 Laboratory of Human Genetics, GIGA Research Institute, Liège, Belgium. 3 Department of Human Genetics, Centre Hospitalier Universi-taire Sart-Tilman, Liège, Belgium. 4 Liège University, Liège, Belgium.
•fast, convenient online submission
•
thorough peer review by experienced researchers in your field
• rapid publication on acceptance
• support for research data, including large and complex data types
•
gold Open Access which fosters wider collaboration and increased citations maximum visibility for your research: over 100M website views per year
•
At BMC, research is always in progress. Learn more biomedcentral.com/submissions
Ready to submit your research? Choose BMC and benefit from:
Received: 16 May 2019 Accepted: 17 July 2019
References
1. Platten M, Wick W, Van den Eynde BJ. Tryptophan catabolism in cancer: beyond IDO and tryptophan depletion. Cancer Res. 2012;72(21):5435–40. 2. Metz R, Duhadaway JB, Kamasani U, Laury-Kleintop L, Muller AJ,
Pren-dergast GC. Novel tryptophan catabolic enzyme IDO2 is the preferred biochemical target of the antitumor indoleamine 2,3-dioxygenase inhibi-tory compound d-1-methyl-tryptophan. Cancer Res. 2007;67(15):7082–7. 3. Kanai M, Funakoshi H, Takahashi H, Hayakawa T, Mizuno S, Matsumoto
K, et al. Tryptophan 2,3-dioxygenase is a key modulator of physiological neurogenesis and anxiety-related behavior in mice. Mol Brain. 2009;2:8. 4. Chang MY, Smith C, DuHadaway JB, Pyle JR, Boulden J, Soler AP, et al.
Car-diac and gastrointestinal liabilities caused by deficiency in the immune modulatory enzyme indoleamine 2,3-dioxygenase. Cancer Biol Ther. 2011;12(12):1050–8.
5. Muller AJ, Sharma MD, Chandler PR, Duhadaway JB, Everhart ME, Johnson BA 3rd, et al. Chronic inflammation that facilitates tumor progression creates local immune suppression by inducing indoleamine 2,3 dioxyge-nase. Proc Natl Acad Sci USA. 2008;105(44):17073–8.
6. Brandacher G, Perathoner A, Ladurner R, Schneeberger S, Obrist P, Winkler C, et al. Prognostic value of indoleamine 2,3-dioxygenase expression in colorectal cancer: effect on tumor-infiltrating T cells. Clin Cancer Res. 2006;12(4):1144–51.
7. Ino K, Yamamoto E, Shibata K, Kajiyama H, Yoshida N, Terauchi M, et al. Inverse correlation between tumoral indoleamine 2,3-dioxygenase expression and tumor-infiltrating lymphocytes in endometrial cancer: its association with disease progression and survival. Clin Cancer Res. 2008;14(8):2310–7.
8. Ino K, Yoshida N, Kajiyama H, Shibata K, Yamamoto E, Kidokoro K, et al. Indoleamine 2,3-dioxygenase is a novel prognostic indicator for endome-trial cancer. Br J Cancer. 2006;95(11):1555–61.
9. Okamoto A, Nikaido T, Ochiai K, Takakura S, Saito M, Aoki Y, et al. Indoleamine 2,3-dioxygenase serves as a marker of poor prognosis in gene expression profiles of serous ovarian cancer cells. Clin Cancer Res. 2005;11(16):6030–9.
10. Nakamura T, Shima T, Saeki A, Hidaka T, Nakashima A, Takikawa O, et al. Expression of indoleamine 2,3-dioxygenase and the recruitment of Foxp3-expressing regulatory T cells in the development and progression of uterine cervical cancer. Cancer Sci. 2007;98(6):874–81.
11. Witkiewicz A, Williams TK, Cozzitorto J, Durkan B, Showalter SL, Yeo CJ, et al. Expression of indoleamine 2,3-dioxygenase in metastatic pancreatic ductal adenocarcinoma recruits regulatory T cells to avoid immune detection. J Am Coll Surg. 2008;206(5):849–56.
12. Brody JR, Costantino CL, Berger AC, Sato T, Lisanti MP, Yeo CJ, et al. Expres-sion of indoleamine 2,3-dioxygenase in metastatic malignant melanoma recruits regulatory T cells to avoid immune detection and affects survival. Cell Cycle. 2009;8(12):1930–4.
13. Seeber A, Klinglmair G, Fritz J, Steinkohl F, Zimmer KC, Aigner F, et al. High IDO-1 expression in tumor endothelial cells is associated with response to immunotherapy in metastatic renal cell carcinoma. Cancer Sci. 2018;109(5):1583–91.
14. Creelan BC, Antonia S, Bepler G, Garrett TJ, Simon GR, Soliman HH. Indoleamine 2,3-dioxygenase activity and clinical outcome following induction chemotherapy and concurrent chemoradiation in Stage III non-small cell lung cancer. Oncoimmunology. 2013;2(3):e23428. 15. Wang W, Huang L, Jin JY, Jolly S, Zang Y, Wu H, et al. IDO immune status
after chemoradiation may predict survival in lung cancer patients. Cancer Res. 2018;78(3):809–16.
16. Botticelli A, Cerbelli B, Lionetto L, Zizzari I, Salati M, Pisano A, et al. Can IDO activity predict primary resistance to anti-PD-1 treatment in NSCLC? J Transl Med. 2018;16(1):219.
17. Munn DH, Sharma MD, Baban B, Harding HP, Zhang Y, Ron D, et al. GCN2 kinase in T cells mediates proliferative arrest and anergy induction in response to indoleamine 2,3-dioxygenase. Immunity. 2005;22(5):633–42.
18. Brenk M, Scheler M, Koch S, Neumann J, Takikawa O, Häcker G, et al. Tryptophan deprivation induces inhibitory receptors ILT3 and ILT4 on dendritic cells favoring the induction of human CD4+CD25+Foxp3+ T regulatory cells. J Immunol. 2009;183(1):145–54.
19. Terness P, Bauer TM, Röse L, Dufter C, Watzlik A, Simon H, et al. Inhibition of allogeneic T cell proliferation by indoleamine 2,3-dioxygenase-express-ing dendritic cells: mediation of suppression by tryptophan metabolites. J Exp Med. 2002;196(4):447–57.
20. Frumento G, Rotondo R, Tonetti M, Damonte G, Benatti U, Ferrara GB. Tryptophan-derived catabolites are responsible for inhibition of T and natural killer cell proliferation induced by indoleamine 2,3-dioxygenase. J Exp Med. 2002;196(4):459–68.
21. Soliman H, Rawal B, Fulp J, Lee JH, Lopez A, Bui MM, et al. Analysis of indoleamine 2-3 dioxygenase (IDO1) expression in breast cancer tissue by immunohistochemistry. Cancer Immunol Immunother. 2013;62(5):829–37.
22. Chen JY, Li CF, Kuo CC, Tsai KK, Hou MF, Hung WC. Cancer/stroma inter-play via cyclooxygenase-2 and indoleamine 2,3-dioxygenase promotes breast cancer progression. Breast Cancer Res. 2014;16(4):410. 23. Lyon DE, Walter JM, Starkweather AR, Schubert CM, McCain NL.
Trypto-phan degradation in women with breast cancer: a pilot study. BMC Res Notes. 2011;4:156.
24. Greene LI, Bruno TC, Christenson JL, D’Alessandro A, Culp-Hill R, Torkko K, et al. A role for tryptophane-2,3-dioxygenase in CD8 T cell suppression and evidence of tryptophan catabolism in breast cancer patient plasma. Mol Cancer Res. 2019;17(1):131–9.
25. Tang X, Lin CC, Spasojevic I, Iversen ES, Chi JT, Marks JR. A joint analysis of metabolomics and genetics of breast cancer. Breast Cancer Res. 2014;16(4):415.
26. D’Amato NC, Rogers TJ, Gordon MA, Greene LI, Cochrane DR, Spoelstra NS, et al. A TDO2-AhR signaling axis facilitates anoikis resist-ance and metastasis in triple-negative breast cresist-ancer. Cresist-ancer Res. 2015;75(21):4651–64.
27. De Bie J, Guest J, Guillemin GJ, Grant R. Central kynurenine pathway shift with age in women. J Neurochem. 2016;136(5):995–1003.
28. Refaey ME, McGee-Lawrence ME, Fulzele S, Kennedy EJ, Bollag WB, Elsal-anty M, et al. Kynurenine, a tryptophan metabolite that accumulates with age, induces bone loss. J Bone Miner Res. 2017;32(11):2182–93. 29. Denkert C, Loibl S, Noske A, Roller M, Müller BM, Komor M, Budczies J,
et al. Tumor-associated lymphocytes as an independent predictor of response to neoadjuvant chemotherapy in breast cancer. J Clin Oncol. 2010;28(1):105–13.
30. Ono M, Tsuda H, Shimizu C, Yamamoto S, Shibata T, Yamamoto H, et al. Tumor-infiltrating lymphocytes are correlated with response to neoad-juvant chemotherapy in triple-negative breast cancer. Breast Cancer Res Treat. 2012;132(3):793–805.
Publisher’s Note
Springer Nature remains neutral with regard to jurisdictional claims in pub-lished maps and institutional affiliations.