Fresenius J Anal Chem (1990) 338:419-422
Fresenius' Journal of
@ Springer-Verlag 1990
Application of radiometric and isotope dilution-mass spectrometric
techniques to the certification of edible oil and fat reference materials
NI. Marlier 1, G. Lognay 1, j . Wagstaffe 2, Ph. Dreze 1, and M. Severin t
t State Faculty of Agricultural Sciences-B-5800-Gembloux, Belgium 2 Bureau of Communities Reference-B-1400-Brussels, Belgium
Summary. A method for the isotope dilution-mass spectro-
metric (ID-MS) determination of butyric acid C4 in butter fat (RM164) was developed in order to support the data gathered from nine experienced European laboratories within the final certification exercise. The ID-MS results (3,46 _+ 0,06 g C4/100 g fat) were in very good agreement with those obtained by "classical" GLC and HPLC techniques. (RM164 was finally certified at 3,49 + 0,06 g C4/100 g fat). This paper reports briefly on a previous preliminary study undertaken to validate a procedure (agreed by the BCR- sterol group) for the isolation of the sterol from fats and oils. By use of labelled sterols and radiometric measurements it was shown that sterol recoveries were superior to 96%.
The procedure was applied during the 3rd In- tercomparison exercise for sterol determination in RM162 (Blend of Soya-Maize oil), for the GLC measurements of cholesterol in RM380 (Whole milk powder) and RM384 (Lyophilized pork muscle) and to the ID-MS determination of cholesterol in RM163 (blend of animal fats) and RM164 (anhydrous milk fat).
Introduction
The use of lipids as Reference Materials (RMs) is of great help for food analysts. Indeed, when certified values are available, the degree of trueness and precision of the analyti- cal measurements can be accurately assessed. Three fatty RMs have been selected in the field of a BCR project: a blend of soya-maize oil (RM162), a tallow-lard mixture (RM163) and anhydrous milk fat (RM164). Their develop- ment was undertaken following a three step procedure:
- Study of the stability/homogeneity of ampouled high quality material
- Preliminary intercomparison (determination of the
properties for which certification could possibly be achieved) - Certification of selected properties.
Fatty acid profile of RM162 and 163 was certified in 1988 [1].
Provisionally certified values for 10 fatty acids and for butyric acid of butterfat (RM164) have been recently pro-
Offprint requests to: M. Marlier
posed. Results for other parameters were considered to be satisfactory for citation as indicative values (see Table 1).
The aim of the present study was to apply Isotope Dilution-Mass Spectrometry (ID-MS) to the certification of butyric acid content and to the determinaion of sterols. Several aspects of the analytical procedure for sterol determi- nation were also investigated by use of radiometric tech- niques.
Certification of butyric acid in butter fat
The availability of butter fat with certified value for butyric acid content is important for quality control purposes:
- this parameter serves as quality indicator
- custom laboratories (EEC) are required to determine the butter content of processed food on the basis of C4 level with the goal to make tariff classification [2].
During the final exercise for C4 certification, we devel- oped a ID-MS technique based on the method of Philips and Sanders [3] which can be summarized as follows:
1. saponification of the milk fat with potassium hydroxide solution followed by acidification with phosphoric acid to liberate the fatty acids, 2. separation of the water soluble fatty acids (including C4) by filtration, 3. direct determination of butyric acid by GC-MS in the pres- ence of heptadeuterated labelled butyric acid as internal standard.
GC-MS conditions: Column: FFAP-CB (Macherey- Nagel F R G ) L = 25 m, ~ = 0.32 ram, df = 0.2 gin, T ° programmation from 55 to 120°C at 20°C then from 120 to 215 ° C at 30 ° C. Carrier: Helium 70KPa.-Spectrometer: R10- 10C (Nermag France), Delsi (France) DI 700 Chroma- tograph.-Fragmentometric analysis: Electron impact at 70 eV. The characteristic mass fragments m/e = 60 (C~) and m/e = 63 (heptadeuterated molecule) were monitored. They result from McLafferty rearrangement.
The work was undertaken in order to support the analyti- cal data obtained by "classical" GLC and HPLC methods in nine European laboratories. The results of the study are summarized in Table 2.
In the optimal chromatographic conditions, ID-MS determinations were fast, reliable and had a good re- peatability. The calibration curves were linear. A slight difference of retention time was always observable between
4 2 0
Table 1. Reference materials
R M 1 6 2 R M 1 6 3 R M 1 6 4
Soya-maize oil Pig-beef fat Milk-fat
F A profile Certified Certified Certified
Butyric acid - - Certified
Sterol profile a Indicative values Indicative values Indicative values
Cholesterol" Indicative values Indicative values Indicative values
U S M Indicative values - -
2-position F A - Indicative values -
P U F A s , T o c o p h e r o l s a n d 12 values are also cited as "indicative" for R M 1 6 2 O n g o i n g study
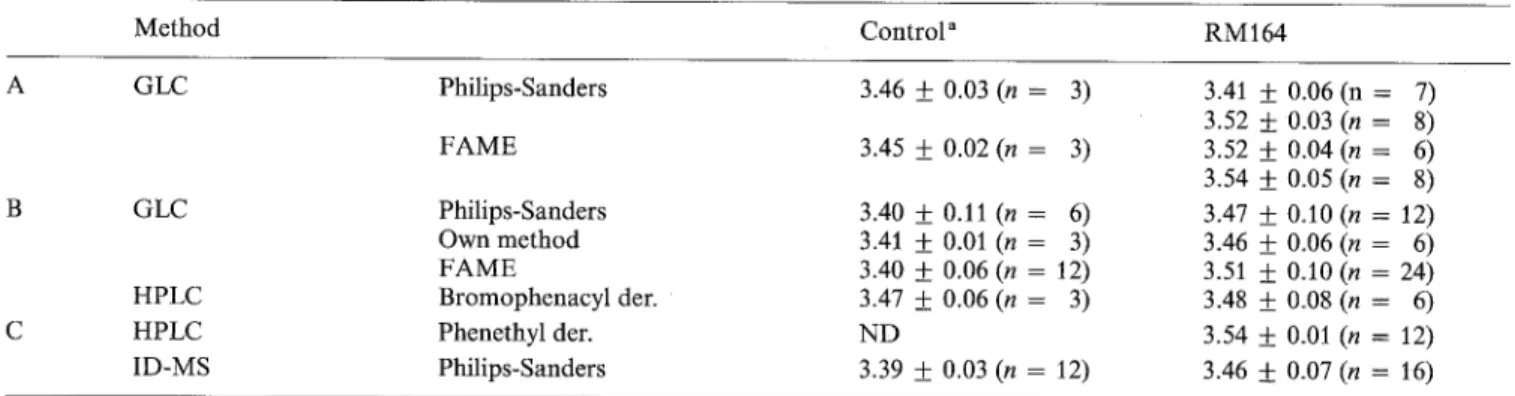
Table 2. Butyric acid c o n t e n t o f a test mixture (Tributyrin-Tallow) a n d o f R M 1 6 4 . A. Values f r o m our laboratory. B. Values f r o m certification exercise. C. S u p p o r t i n g m e a s u r e m e n t s (ID-MS). Results expressed in g C4/100 g fat. F A M E = fatty acid m e t h y l ester, der. = derivative
M e t h o d C o n t r o l a R M 1 6 4 A G L C Philips-Sanders 3.46 _+ 0.03 (n = 3) 3.41 _+ 0.06 (n = 7) 3.52 + 0.03 (n = 8) F A M E 3.45_+ 0 . 0 2 ( n = 3) 3.52_+ 0 . 0 4 ( n = 6) 3.54 _+ 0.05 (n = 8) B G L C Philips-Sanders 3.40 _+ 0.11 (n = 6) 3.47 _+ 0.10 (n = 12) O w n m e t h o d 3.41 _+ 0.01 (n = 3) 3.46 _+ 0.06 (n = 6) F A M E 3.40 __ 0.06 (n = 12) 3.51 _ 0.10 (n = 24) H P L C B r o m o p h e n a c y l d e r . 3.47 + 0.06 (n = 3) 3.48 _+ 0.08 (n = 6) C H P L C P h e n e t h y l der. N D 3.54 + 0.01 (n = 12) I D - M S Philips-Sanders 3.39 + 0.03 (n = 12) 3.46 + 0.07 (n = 16) "Theoretical value: 3.41
Table 3. Results (set m e a n s a n d 95% confidence intervals) accepted for the certification o f the butyric acid c o n t e n t o f a n h y d r o u s milk fat RM164. F A M E fatty acid methyl ester. Butyric acid c o n t e n t mass fraction (g/100 g)
5 P-S 15 P-S 13 O w n 2 F A M E 6 F A M E 7A F A M E 8 F A M E 5 H P L C 10 H P L C 7B G C - M S 3.250 3.350 3.450 3.550 3.650 + . . . + . . . + . . . + . . . ÷ . . . ÷ . . . ÷ . . . ÷ . . . ÷ . . . . (- • ( , ) ( - * ) ) ( - , - ) ( . . . , . . . _) * -) . ( . . . * . . . ) Participating laboratories:
Facult6 des Sciences A g r o n o m i q u e s de l'Etat, G e m b l o u x , B H a n n a h R e s e a r c h Institute, Ayr, U K
Instituto del Frio, C u i d a d Universitaria, M a d r i d , SP Instituto Sperimentale Latterio Caseario, Lodi, I
D p t . Scienze e Tecnologie Alimentarie M i c r o b i o l o g i c h e Universitadi M i l a n o , Italy. L a b o r a t o r y o f the G o v e r n m e n t Chemist, L o n d o n , U K
L e a t h e r h e a d F o o d R e s e a r c h Association, L e a t h e r d e a d , U K
Ministry o f Agriculture, Fisheries a n d F o o d s -- M A A F , L o n d o n , U K N a t i o n a l F o o d Institute, Soborg, D K
butyric acid (5.07 rain) and the heptadeuterated molecule (5.04 rain).
The values achieved for the test mixture (blend of tributyric and refined beef tallow) and for butter fat by I D - MS are in very g o o d agreement with those obtained in our laboratory by using "classical" G L C methods (C4 measured directly or as methyl ester). They support very well the ana- lytical data gathered from nine experienced European labora- tories (Table 3). R M 1 6 4 (anhydrous milk fat) was finally certified at 3.49_+ 0.06 g/100 g fat.
T a b l e 4. General analytical scheme for sterol determination in fatty materials. The arrows show the different steps investigated by radiochemical analyses
Saponification of the fat after addition of ISTD (Betulin or cholestane)
Extraction of unsaponifiable (USM) with diethyl ether Water washings of the extract
Fractionation of USM (Preparative TLC) $
Isolation of sterols from the gel Derivatization (TMS)
+
Capillary GLC analysis
©
T a b l e 5. Sterol recoveries after saponification, extraction of unsa- ponifiable and washings
Fatty material Sterol recoveries (%) Losses by after 6 extractions washings with diethyl ether with water (%) Sunflower ÷ 3H-cholesterol 96.2 + 1.3 (n = 6) 1.0 ± 0.2 Sunflower + 3H cholesteryl oleate 100.7 ± 0.7 (n = 7) 0.7 ± 0.1 Butter oil + 3H cholesterol 99.2 + 1.2 (n = 3) 0.7 + 0.1 Butter oil + 3H cholesteryl oleate 102.7 _+ 0.2 (n = 3) 0.3 + 0.2 Each radioactivity counting was repeated 5 times
421 S t e r o l a n a l y s i s
The certification o f sterol profile and cholesterol content is o f capital importance for nutritional standpoints and for the research of adulteration.
The first interlaboratory trials undertaken within the B C R project revealed an insufficient level o f agreement of the results for absolute sterol content. Nevertheless the sterol profiles (expressed in % of total sterols) were satisfactory [4] : Additional investigations suggested that a source o f error could be associated to the initial steps (lipid saponification, extraction and washings o f unsaponifiable) of the m e t h o d (Table 4).
Finally, a procedure for the isolation of sterols was agreed by the BCR-Sterol group and consequently validated by use of labelled sterols and radiometric measurements. The recovery of both free (3H cholesterol) and esterified (3H cholesteryl oleate) sterols was investigated because the two forms are present in food lipids. Spiked sunflower and butter oil were used in order to evaluate the influence of different kind o f soaps on the recovery o f sterols.
The design of the work and all experimental conditions were reported in detail in a previous paper [5].
The results of this study are summarized in Table 5. The radiochemical investigations have shown that:
- cholesterol was quantitatively extracted regardless of the lipid tested (recovery > 96%),
- cholesteryl oleate was quantitatively saponified, - losses by washings did not exceed 1%,
- there were no appreciable amounts of sterol degrada- tion products (TLC and radiodensitometric scanning).
The whole procedure was applied to different reference materials:
- determination o f sterol content o f soya-maize oil (RM162) (3rd intercomparison), measurement of cholesterol absolute level in two additional B C R ' s reference materials: RM380 (milk powder) and R M 3 8 4 (lyophilized pork muscle) and determination of cholesterol in RM163 and R M I 6 4 by ID-MS. The I D - M S conditions were the following:
C o l u m n : RSL-300 from R S L (Belgium) L = 25 m, ~ = 0 . 3 2 m m , df = 0.3 gm, isothermal analysis at 265°C. Carrier: Helium 70 KPa. Spectrometer: RI0-10C (Nermag France), Delsi (France) Dt700 Chromatograph.
Fragmentometric analysis: Electron I m p a c t at 70 eV, molecular ions at m/e = 386 (cholesterol) and me/e = 387 (ISTD) were monitored.
The results of the work are presented in Table 6.
T a b l e 6. Sterol content of several BCR reference materials
Sterols in RM162. Mean values (rag/100 g RM) and rsd of results from 9 labs. (BCR studies)
Total sterols Cholesterol Campesterol Stigmasterol 2nd Intercomparison [4] 698 (18) 4.6 (59) 148 (15) 68 (18) 3rd Intercomparison 656 ( 5 ) 3.0 (23) 141 ( 6 ) 61 ( 8 ) Cholesterol level of 4 RMS (mg cholesterol/100 g RM). Results from our laboratory.
RM Method for quantitation Cholesterol content
B-sitosterol 434 (18) 418 ( 5 )
Values from BCR studies RM 380 (Milk Powder)
RM 384 (Lyophilized Pork Muscle) RM 163 (Pig-beef fat blend) RM 164 (Anhydrous milk fat)
GLC (Betulin as ISTD) GLC (Betulin as ISTD)
ID-MS (13 C-Cholesterol as ISTD) ID-MS (13C-Cholesterol as ISTD)
92 ± 2 (n = 6) 225 ± 1 (n = 6) 138.7 ± 0.2 (n = 3) 275.2 ± 0.8 (n = 3) N . D . N.D. 100 to 140 [1] 275 +_ 30 [6]
422
The 3rd intercomparison yielded improved but not entirely satisfactory results. A fourth exercise is planned for spring 1990 in which special attention will be paid to the analytical conditions (use of ISTD concentration at the level of sterols to be measured, column resolution etc.). Choles- terol analyses in RM380 (whole milk powder) and RM384 (pork muscle) were repeatable and in agreement with those commonly found in the literature. Meanwhile a certification study, the results can be considered as indicative values.
In the ID-MS study, cholesterol was analysed without derivatization on a medium polar column. Free cholesterol and ISTD co-eluted at 9.30 min. The repeatability of in- jections was very good (srd < 0.6%). The results were accept- able and sufficiently repeatable in comparison with those from previous BCR ring-tests (Table 6). Nevertheless, due to natural laC isotopic contribution of cholesterol to the ISTD peak, the calibration curves were not linear. To overcome this drawback deuterium multilabelled cholesterol will be used in the next study.
The certification of the sterol profile of soya-maize oil (RM162), pig beef fat (RM163) and butter fat (RM164) marked with phytosterols, is in progress in different European
laboratories and will lead to GC-MS identification of individ- ual sterols present in the chromatogram.
Acknowledgements.
The authors wish to thank Mr. D. Trisman andMrs. C. Charlier for helpful technical assistance. This work was financially supported by the European Economic Communities (DG-XII) - Bureau of Communities References.
References
1. Pocklington WD, Wagstaffe PJ (1988) The certification of the fatty acid profile of two oil and fat reference materials. Commu- nity Bureau of References report EUR l 1002 EN
2. Official Journal of the European Communities, EEC regulations 4056/87 and 4154/87 (22/12/1987)
3. Pocklington WD, Hautfenne A (1986) Pure Appl Chem 58:1419-1428
4. Pocklington WD (1988) Fresenius Z Anal Chem 332:674-678 5. Lognay G, Dreze Ph, Wagstaffe P J, Marlier M, Severin M (1989)
The Analyst (London) 114:1287-1291 Received April 20, 1990