Cost-Utility Analysis of Imaging for Surveillance and
Diagnosis of Hepatocellular Carcinoma
par
Paulo Henrique Moura Costa Lima, MD
Programme de Sciences biomédicales Faculté de médecine
Mémoire présenté à la Faculté de médecine en vue de l’obtention du grade de Maîtrise en sciences (M. Sc.) en Sciences biomédicales option Recherche clinique
Résumé
Le carcinome hépatocellulaire (CHC) est une complication sérieuse associée aux maladies hépatiques chroniques. Les lignes directrices actuelles recommandent la surveillance du CHC par échographie tous les six mois. Cependant, la surveillance par échographie peut être difficile chez certains patients, notamment ceux atteints de cirrhose ou d'obésité. Autrement, la tomodensitométrie (TDM), l'imagerie par résonance magnétique (IRM) et l'IRM abrégée ont été explorées comme techniques d'imagerie alternatives et peuvent être utilisées chez les patients qui sont susceptibles d’avoir une échographie techniquement inadéquate. L’objectif de ce mémoire est d’évaluer l’impact économique de différentes stratégies de dépistage et de diagnostic basées sur l'imagerie chez des patients à risque de CHC, tout en tenant compte d'examens techniquement inadéquats et du taux de compliance des patients au programme de dépistage.
Nous avons comparé sept stratégies de dépistage et diagnostic: stratégie A, échographie pour le dépistage et TDM pour le diagnostic; stratégie B, échographie pour le dépistage et IRM pour le diagnostic; stratégie C, échographie pour le dépistage et TDM pour une surveillance inadéquate ou positive; stratégie D, échographie pour le dépistage et IRM pour un dépistage inadéquat ou positif; stratégie E, dépistage et diagnostic par TDM suivis par une IRM en cas de dépistage inadéquat; stratégie F,
stratégie G, dépistage avec IRM abrégée suivi par TDM pour un dépistage inadéquat ou IRM pour un dépistage positif. Deux scénarios de compliance au programme de surveillance ont été évalués: optimal et conservateur. Pour chaque scénario, la stratégie la plus coût-efficace reposait sur un seuil de propension à payer de Can$50,000 (dollars Canadiens) par année de vie ajustée en fonction de la qualité (AVAQ). Nous avons également effectué des analyses de sensibilité.
Nos résultats ont démontré que la stratégie E était la stratégie la plus coût-efficace dans le scénario de compliance optimal (Can$13,631/AVAQ). Cependant, dans le scénario conservateur, la stratégie G constituait l'alternative la plus coût-efficace pour remplacer la pratique actuelle de surveillance par échographie (Can$39,681/AVAQ). Les analyses de sensibilité ont confirmé l'analyse de base dans le scénario de compliance optimal. Par contre, plusieurs paramètres ont modifié le rapport de coût-efficacité dans le scénario d’observance conservateur.
En effectuant cette analyse économique, nous avons conclu qu'une approche individuelle, tenant compte des particularités cliniques des patients, est plus coût-efficace que la stratégie actuelle uniforme. Cependant, avant de mettre en place un programme de surveillance incorporant des modalités d'imagerie autres que l'échographie, les futures études devraient se concentrer sur le fardeau économique associé aux diagnostics faux positifs du CHC et sur la performance diagnostique d'examens d'IRM abrégés dans le scénario de surveillance.
Mots-clés : coût-efficacité, détection précoce, cancer du foie, imagerie du foie, modèle
Abstract
Hepatocellular carcinoma (HCC) is a serious complication associated with chronic liver disease. Current guidelines recommended HCC surveillance using ultrasound (US) every six months. However, US surveillance can be challenging for some patients, particularly those with cirrhosis or obesity. Alternately, computed tomography (CT), magnetic resonance imaging (MRI), and abbreviated MRI have been explored as alternative imaging modalities and may be used in selected patients who are likely to have experienced inadequate US examinations. In this thesis, we aimed to assess the cost-effectiveness of imaging-based surveillance and diagnostic strategies in patients at risk of HCC while taking into account technically inadequate examinations and patients’ compliance.
We compared seven surveillance and diagnostic strategies: strategy A, US for surveillance and CT for diagnosis; strategy B, US for surveillance and MRI for diagnosis; strategy C, US for surveillance and CT for inadequate or positive surveillance; strategy D, US for surveillance and MRI for inadequate or positive surveillance; strategy E, surveillance and diagnosis with CT followed by MRI for inadequate surveillance; strategy F, surveillance and diagnosis with MRI followed by CT for inadequate surveillance; and strategy G, surveillance with abbreviated MRI followed by CT for inadequate surveillance or MRI for positive surveillance. Two compliance scenarios were evaluated: optimal and conservative. For each scenario, the most cost-effective strategy was based on a willingness-to-pay threshold of
Can$50,000 (Canadian dollars) per quality-adjusted life year (QALY). We also performed sensitivity analyses.
Our results demonstrated that strategy E was the most cost-effective strategy in scenarios with optimal patient compliance (Can$13,631/QALY). However, in scenarios with low patient compliance, strategy G was the most cost-effective alternative to the current US-surveillance practice (Can$39,681/QALY). Sensitivity analyses supported the base-case analysis in the optimal compliance scenario; however, several parameters altered the cost-effectiveness relationship in the conservative compliance scenario.
By performing this economic analysis, we concluded that an individual approach, considering the clinical particularities of the patients, is more cost-effective than the current “one-size-fits-all” strategy. However, before implementing a surveillance program incorporating imaging modalities other than US, future studies should address the economic burden associated with false-positive HCC diagnoses and the accuracy of abbreviated MRI examinations in a surveillance setting.
Keywords: cost-effectiveness, early detection, liver cancer, liver imaging, Markov
Table of Contents
Résumé ... i
Abstract ... iv
Table of Contents ... vi
List of Tables ... xi
List of Figures ... xii
List of Appendix ... xv
List of Abbreviations ... xvi
Acknowledgements ... xix
1
Introduction ... 1
1.1 General Introduction ... 1
1.2 Reasons to Perform the Economic Analysis ... 3
1.3 Thesis Objectives ... 3
1.3.1General Objective ... 3
1.3.2Specific Objectives ... 4
2
Hepatocellular Carcinoma ... 6
2.1 Epidemiology ... 6
2.1.1Distribution ... 6
2.1.2Etiology and Risk Factors ... 8
2.2 Natural History ... 11
2.2.1Molecular Phase ... 11
2.2.2Preclinical Phase ... 12
2.2.3Clinical Phase ... 13
2.3 Surveillance and Diagnosis ... 13
2.3.1Principles and Importance of Surveillance ... 13
2.3.2At-Risk Patients ... 16
2.3.3Surveillance Testing ... 17
2.3.4Diagnostic Testing ... 20
2.4 Management ... 25
2.4.1Barcelona Clinic Liver Cancer Staging (BCLC) ... 26
2.4.2Early-Stage HCC (BCLC 0-A) ... 28
2.4.3Intermediate-Stage HCC (BCLC B) ... 29
2.4.4Advanced-Stage HCC (BCLC C) ... 29
2.4.5End-Stage HCC (BCLC D) ... 30
3.2 Types of Economic Analysis ... 33
3.2.1Cost-Effectiveness Analysis (CEA) ... 33
3.2.2Cost-Utility Analysis (CUA) ... 34
3.2.3Cost-Benefit Analysis (CBA) ... 34
3.2.4Cost-Minimization Analysis (CMA) ... 34
3.3 Choosing the Population and Comparators ... 35
3.4 Perspective ... 36
3.5 Time Horizon ... 37
3.6 Measurement of Costs ... 39
3.6.1Costs versus Time (Adjusting and Discounting) ... 39
3.6.2Cost Estimation ... 41
3.7 Measurement of Health ... 41
3.7.1The Concept of Utility ... 42
3.7.2 The Concept of Health-Related Quality of Life (HRQoL) ... 45
3.7.3The Concept of Quality-Adjusted Life Year (QALY) ... 46
3.8 Decision Analysis (Modeling) ... 47
3.8.1Decision Tree ... 48
3.8.2Markov Modeling ... 49
3.8.3Discrete Event Simulation (DES) ... 50
3.9 Calculation and Interpretation of Results ... 50
3.10 Sensitivity Analyses ... 55
3.10.2Probabilistic Sensitivity Analysis ... 55
4
Cost-Utility Analysis of Imaging for Surveillance and
Diagnosis of Hepatocellular Carcinoma ... 57
4.1 Abstract ... 57
4.1.1Objective ... 57
4.1.2Materials and Methods ... 57
4.1.3Results ... 58
4.1.4Conclusion ... 58
4.2 Introduction ... 58
4.3 Materials and Methods ... 60
4.3.1Model Structure and Population ... 60
4.3.2Competing Imaging Strategies ... 62
4.3.3Treatment Options ... 65
4.3.4Model Parameter Estimates ... 66
4.3.5Costs and Utilities ... 70
4.3.6Base-Case Analysis ... 75
4.3.7Sensitivity Analyses ... 75
4.4 Results ... 76
4.4.1Base-Case Analyses ... 76
4.5 Discussion ... 85
4.6 Conclusion ... 88
5
Conclusion ... 90
Bibliography ... 92
Appendix ... cxviii
List of Tables
Table 2.1 Surveillance Recommendations According to Different Associations ... 15
Table 2.2 Hepatocellular Carcinoma Staging Systems ... 25
Table 3.1 Relevant Costs According to Different Perspectives ... 37
Table 3.2 Probabilities and Costs Used to Explain the Calculations ... 52
Table 3.3 Calculation for the Example of Antibiotics ... 53
Table 4.1 Initial Parameters and Transition Probabilities ... 67
Table 4.2 Imaging Techniques Characteristics ... 69
Table 4.3 Health-Care Costs and Utilities ... 70
Table 4.4 Micro-Costing of Ultrasound, Computed Tomography, and Magnetic Resonance Imaging Examinations ... 73
Table 4.5 Micro-Costing of Abbreviated Magnetic Resonance Imaging According to Acquisition Times ... 74
Table 4.6 Cost-Utility Analysis ... 77
List of Figures
Figure 1.1 HCV prevalence and HCV-related HCC incidence curves in Canada. ... 2
Figure 2.1 Worldwide HCC age-standardized incidence rates in 2018. ... 7
Figure 2.2 Worldwide HCC incidence rates according to age and sex in 2018. ... 8
Figure 2.3 Distribution of HCC-related deaths by risk factor in selected regions. ... 9
Figure 2.4 Schematic representation of HCC’s natural history. ... 12
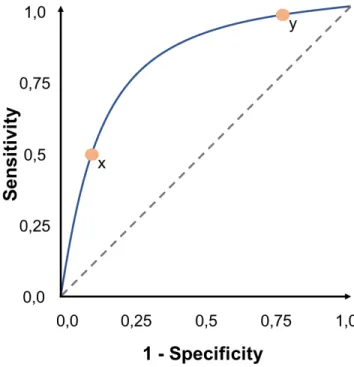
Figure 2.5 Receiver Operating Characteristic (ROC) curve. For the same test (blue curve), the higher the sensitivity (point y) the lower the specificity and the lower the sensitivity (point x) the higher the specificity. ... 18
Figure 2.6 Small hypoechoic nodule in a cirrhotic liver corresponding to hepatocellular carcinoma (arrow). ... 19
Figure 2.7 American Association for the Study of Liver Diseases (AASLD) surveillance and diagnostic algorithm. ... 22
Figure 2.8 Schematic representation of LI-RADS major criteria for hepatocellular carcinoma diagnosis. ... 23
Figure 2.9 Summary of CT and MRI diagnostic Liver Imaging Reporting and Data System major features. ... 24
Figure 2.10 Barcelona Clinic Liver Cancer Staging (BCLC) classification and treatment schedule. ... 27
Figure 3.1 Health care cost in selected countries as a percentage of gross domestic
product. ... 32
Figure 3.2 Influence of time horizon in economic analysis. ... 38
Figure 3.3 Schematic representation of loss of purchasing power in Canada. ... 40
Figure 3.4 Schematic representation of the time trade-off method. ... 43
Figure 3.5 Schematic representation of the standard gamble method. ... 44
Figure 3.6 Schematic representation of visual analogue scale method. ... 45
Figure 3.7 Schematic representation of quality-adjusted life year for a patient with decompensated cirrhosis (patient A) and decompensated cirrhosis submitted to a LT (patient B). ... 47
Figure 3.8 Schematic representation of a decision tree. ... 48
Figure 3.9 Schematic representation of a Markov model. ... 50
Figure 3.10 Decision tree used as an example to explain the calculations. ... 51
Figure 4.1 Simplified Markov model illustrating surveillance (gray box) and diagnostic imaging techniques (blue box) interposed on health states (green boxes) and temporary states (beige and pink boxes). Gray arrows indicate health state transitions, and black arrows indicate temporary state transitions (management of positive imaging results). ... 61
Figure 4.2 Chart of hepatocellular carcinoma (HCC) surveillance and diagnostic strategies A–G. ... 64
Figure 4.4 Cost-utility curves. A and B, Graphs show cost-utility curves for optimal (A)
and conservative (B) surveillance scenarios. ... 79
Figure 4.5 One-way sensitivity analyses. A and B, Graphs show analyses for optimal
(strategy E vs strategy A; A) and conservative (strategy G vs strategy C; B) surveillance scenarios. Black lines represent expected incremental cost-effectiveness ratio (ICER) values. Dotted gray lines represent willingness-to-pay threshold. Costs are shown in Canadian dollar (Can$). ... 82
Figure 4.6 Acceptability curves after 10,000 iterations. A and B, Graphs show
acceptability curves (A) and conservative (B) surveillance scenarios. Dotted gray lines represent willingness-to-pay threshold. Costs are shown in Canadian dollars (Can$). ... 84
List of Appendix
Appendix 1 Manuscript: Cost-Utility Analysis of Imaging for Surveillance and Diagnosis
List of Abbreviations
AASLD American Association for the Study of Liver Diseases AFP Alpha-Fetoprotein
APHE Arterial Phase Hyperenhancement ASR Age-Standardized Rate
BCLC Barcelona Clinic Liver Cancer Staging
CASL Canadian Association for the Study of the Liver CBA Cost-Benefit Analysis
CEA Cost-Effective Analysis CEUS Contrast-Enhanced US CI Confidence Interval
CLIP Cancer of the Liver Italian Program CMA Cost-Minimization Analysis
CT Computed Tomography
CUA Cost-Utility Analysis
CUPI Chinese University Prognostic Index DES Discrete Event Simulation
DWI Diffusion-Weighted Imaging
EASL European Association for the Study of the Liver ECA Extracellular Contrast Agent
ER Estrogen Receptor GDP Gross Domestic Product HBV Hepatitis B Virus
HCC Hepatocellular Carcinoma HCV Hepatitis C Virus
HRQoL Health-Related Quality of Life
ICER Incremental Cost-Effectiveness Ratio JIS Japan Integrated Staging Score LT Liver Transplantation
MRI Magnetic Resonance Imaging NAFLD Non-Alcoholic Fatty Liver Disease
OR Odds Ratio
PEI Percutaneous Ethanol Injection PST Performance Status Test QALY Quality-Adjusted Life Year RFA Radiofrequency Ablation
ROC Receiver Operating Characteristic SDI Sociodemographic Index
TACE Transarterial Chemoembolization TNM Tumor Node Metastasis
For my parents and devoted wife, who always believed and supported my dreams
Acknowledgements
It is a great honor for me to present this thesis as the result of the last two years of hard work, which would not have been possible without the generosity, dedication, and experience of Dr. An Tang and Dr. Catherine Beauchemin. I will be eternally grateful for the opportunity that Dr. Tang gave me. In spite of his many commitments, he showed me the way by taking time to tutor me through my master’s program, from the conception of the study to the revision of the final version of this thesis. Dr. Tang is an inspiring professor and profoundly impacted my professional development. I look forward to working with him again.
I am also profoundly grateful to Dr. Catherine Beauchemin. It was a tremendous honor for me to have Dr. Beauchemin as my research director along with Dr. Tang. Despite her professional agenda, she was always available to support me through the conceptualization and construction of the economic models. Furthermore, she significantly contributed to the revision of this thesis. The high methodological quality of this work can be attributed in a great measure to Dr. Beauchemin’s expertise in economic analysis.
I would like to acknowledge the essential contribution of all the other co-authors who participated in the construction of the published manuscript, which was the basis for the development of this thesis: Boyan Fan, Joshua Bérubé, Dr. Milena Cerny, Dr.
I am also grateful to Dr. Luigi Lepanto, Dr. Laurent Létourneau-Guillon, Dr. Michelle Savoie, and Dr. Isabelle Chabot, who accepted to serve as jury members for my master’s thesis.
In this acknowledgement, I would like to mention the millions of patients with chronic liver disease all over the world. This work only exists because of them and is a small and humble contribution whose main objective is to help mitigate their suffering. I would like to thank my dear friends, Diogo, Marina, Caroline, Fábio, Tatiana, César, Daniele, and Mozir, who were my second family in Montreal.
Finally, I would like to thank God, for giving me the strength and knowledge to complete this journey, my parents Francisco Robson and Gisele Moura, for their support and dedication, and my wife Ana Marília, for her love and encouragement. This achievement would not have been possible without them, to whom I dedicate this dissertation.
1
Introduction
1.1 General Introduction
Hepatocellular carcinoma (HCC) is the sixth most common cancer and the fourth cause of cancer-related deaths worldwide [1]. In Canada, HCC is the only malignancy for which mortality is rising, and the hepatitis C virus (HCV) infection is considered one of the most critical risk factors associated with HCC (see Etiology and Risk Factors below) [2, 3]. Although the prevalence of HCV infection reached its peak in 2003, the incidence of HCV-related HCC is expected to rise in the next decades due to the aging of the infected population and progression of liver fibrosis to cirrhosis [4, 5] (Figure
1.1).
In parallel, HCC-associated mortality and costs are estimated to increase, imposing a heavy human and economic burden on patients, their families, and society [4, 6]. Historically, the diagnosis of HCC has been made in advanced stages, when curative treatment options are no longer eligible, and the costs linked to care are higher [7]. The implementation of surveillance programs modified this trend by increasing the rate of early-stage tumor detection [8-10].
Figure 1.1 HCV prevalence and HCV-related HCC incidence curves in Canada.
Data extracted from Myers et al. [4] and Remis et al. [5]. HCC = hepatocellular carcinoma, HCV = hepatitis C virus.
Due to limitations in health care system budgets, large-scale interventions, such as surveillance programs, are evaluated according to their potential cost-effectiveness before being implemented. In this scenario, economic analysis in health care proposes to identify, measure, value, and compare the costs and health outcomes of different health technologies [11]. Economic evaluations are important guides for policymakers, providing them with valuable evidence.
0 50 100 150 200 250 300 350 1960 1970 1980 1990 2000 2010 2020 2030
N
u
m
b
e
r
o
f
C
a
se
s
Year
HCV Prevalence and HCV-Related HCC Incidence Curves
in Canada (1960 to 2030)
1.2 Reasons to Perform the Economic Analysis
There is a knowledge gap regarding the cost-effectiveness of surveillance for HCC. Current North American guidelines recommend HCC surveillance using ultrasound (US) every six months [12, 13]. However, US surveillance can be challenging in some patients, particularly those with Child-Pugh class C cirrhosis (who have advanced liver disease with innumerable nodules which may mask liver cancer) or obesity. In these patients, the US inadequacy rate can be as high as 33%, compromising surveillance effectiveness [14].
Other imaging modalities, like computed tomography (CT), magnetic resonance imaging (MRI), and abbreviated MRI, may be helpful alternatives for patients who are prone to inadequate US. However, previous economic analyses that have assessed this issue did not compare all available imaging modalities or did not take into consideration the effect of inconclusive surveillance imaging and patient compliance in their models [15-18].
1.3 Thesis Objectives
1.3.1 General Objective
To assess the cost-effectiveness of imaging-based surveillance and diagnostic strategies in patients at risk of HCC, taking into account technically inadequate examinations and patient compliance.
1.3.2 Specific Objectives
• To assess the cost-effectiveness of strategies relying on combinations of four imaging techniques: US, CT, MRI, and abbreviated MRI;
• To identify which is the most cost-effective strategy;
• To identify the parameters that have the greatest impact on the cost-effectiveness ratios.
1.4 Reading Guide
This master’s thesis was structured so as to be accessible to different audiences, including medical students, hepatologists, general radiologists, and health economists. Medical students should read this document sequentially. Hepatologists and general radiologists, who may already be familiar with the medical aspects of HCC, may skip the Chapter 2 and begin their reading with the review of economic analysis in health care provided in Chapter 3. Health economists interested in this subject, but without a previous background in HCC, may begin their reading with the brief medical review provided in Chapter 2 and skip Chapter 3.
Chapters Description:
• Chapter 2: introduces HCC and reviews its epidemiology, natural history, surveillance, diagnosis, and management.
• Chapter 4: presents the cost-utility study performed to address the thesis objectives. The published article is presented in Appendix 1.
• Chapter 5: discusses the lessons learned, implications for patient care, and future directions.
2
Hepatocellular Carcinoma
HCC represents approximately 85% of all primary liver cancer [19]. HCC has a particular epidemiology, natural history, surveillance, diagnosis, and management. This chapter aims to review these key concepts.
2.1 Epidemiology
HCC is a major health problem worldwide, ranked as the sixth most common cancer and the fourth most common cause of cancer-related mortality [1]. In Canada, HCC has one of the fastest rising cancer incidences, with an increase of 2.6% to 3.6% per year [20]. Despite advances in diagnosis and management, the 5-year net survival of HCC in Canada is only about 19%, highlighting the aggressive nature of this cancer by the time of its diagnosis [21].
2.1.1 Distribution
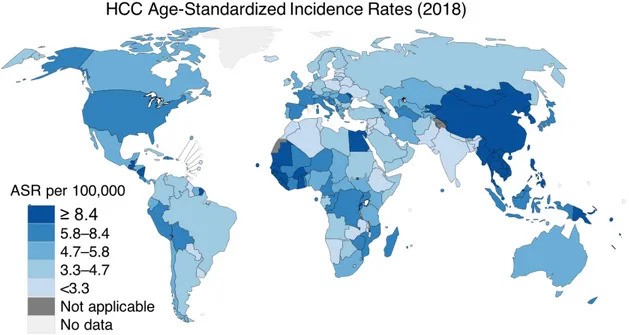
The incidence of HCC differs widely according to geographic regions. While Northern Europe, Australia, New Zealand, and North and South America are the regions with the lowest rates, more than 80% of HCC cases occur in developing countries [1, 22] (Figure 2.1). However, in the last few decades, some regions traditionally classified as high-incidence areas are experiencing a decrease in the
Canada, are facing an increase [2, 23]. These variations across geographic regions are explained, at least in part, due to regional differences of important risk factors (see Etiology and Risk Factors below).
Figure 2.1 Worldwide HCC age-standardized incidence rates in 2018. Reproduced
with permission from the Global Cancer Observatory [1]. ASR = age-standardized rate, HCC = hepatocellular carcinoma.
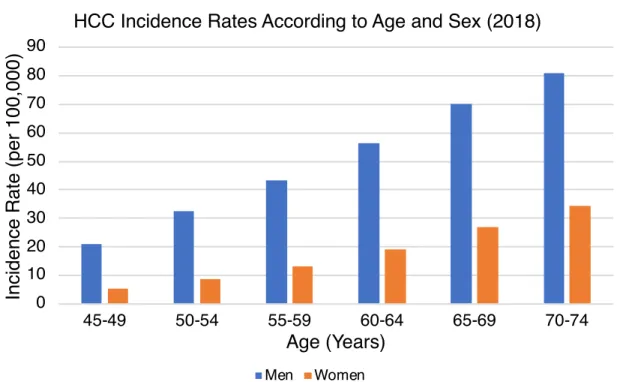
Furthermore, there is a significant incidence difference according to gender. Men are at a higher risk to develop HCC than women [1, 24]. This discrepancy is more evident in high-incidence regions, where men are affected 3.7 times more frequently than women [25]. Age also influences the HCC incidence. Since the pathogenesis of
HCC requires several decades, starting from the exposure to an etiologic agent until the diagnosis (see Natural History below), older patients are more prone to develop HCC [1, 24] (Figure 2.2).
Figure 2.2 Worldwide HCC incidence rates according to age and sex in 2018. Data
extracted from the Global Cancer Observatory [1]. HCC = hepatocellular carcinoma.
2.1.2 Etiology and Risk Factors
A variety of risk factors associated with HCC development have already been identified. This knowledge has enabled the recognition of etiological agents and risk
0 10 20 30 40 50 60 70 80 90 45-49 50-54 55-59 60-64 65-69 70-74 In ci d e n ce R a te ( p e r 1 0 0 ,0 0 0 ) Age (Years)
HCC Incidence Rates According to Age and Sex (2018)
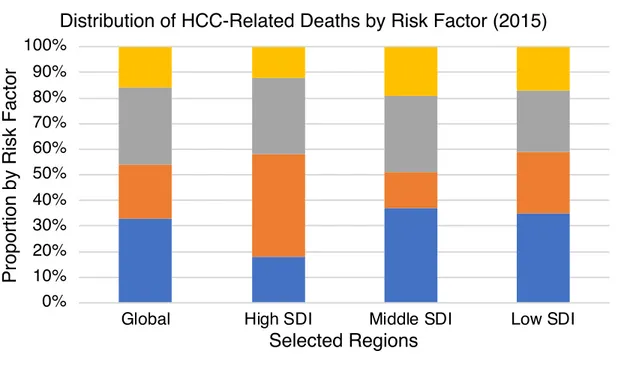
infections, alcohol abuse, and non-alcoholic fatty liver disease (NAFLD) [26]. The importance of one risk factor over another varies according to the region studied (Figure 2.3). About 80% to 90% of patients who develop HCC have cirrhosis, which is the final common pathway of chronic liver aggression, regardless of the underlying etiology [27].
Figure 2.3 Distribution of HCC-related deaths by risk factor in selected regions. Data
extracted from the Global Burden of Disease Liver Cancer Collaboration [28]. HCC = hepatocellular carcinoma, SDI = sociodemographic index.
0% 10% 20% 30% 40% 50% 60% 70% 80% 90% 100%
Global High SDI Middle SDI Low SDI
P ro p o rt io n b y R isk F a ct o r Selected Regions
Distribution of HCC-Related Deaths by Risk Factor (2015)
HBV is the leading cause of HCC development worldwide, accounting for up to 50% of all cases [22]. This risk factor is even more important in developing countries, regions where HBV infection is considered endemic and transmission generally occurs during childhood, by vertical or perinatal exposure [29, 30]. In contrast, the horizontal transmission (sexual or parenteral routes), is the most common in developed countries [29]. HBV is linked to HCC even in the absence of cirrhosis; however, patients with cirrhosis are at a higher risk [19]. The implementation of vaccination programs and the advent of successful treatment regimens have led to a decline of HBV-associated HCC incidence worldwide [31-33].
HCV is the most common risk factor for HCC in developed countries [24, 34]. In Canada, modeling data suggest that by 2035, cases of HCV-related HCC will have increased by 205%, when compared to 2013 levels; although more effective and better tolerated antivirals may change this trend [4]. Differently from chronic HBV infection, virtually all HCCs associated with chronic HCV occur in patients with advanced liver fibrosis or cirrhosis [35, 36]. The majority of HCV infections is acquired in adulthood, generally as a result of exposure to contaminated blood products or intravenous drug abuse [37]. HCV treatment is associated with a decrease in risk of developing HCC, though it is not completely eliminated [38, 39].
Alcohol abuse is the third most common cause of HCC, especially in Western countries [37, 40]. Heavy alcohol intake can lead to cirrhosis and, consequently, to
seems that the increased HCC risk associated with NAFLD is limited to patients with cirrhosis [42]. Other risks factors are diabetes mellitus, obesity, aflatoxin, iron overload, alpha-1-antitrypsin deficiency, acute intermittent porphyria, and gallstones [37, 43].
2.2 Natural History
Historically, HCC was diagnosed, almost invariably, in its late stages, when curative treatment options are not suitable and the progression to death occurs rapidly [44]. The implementation of surveillance strategies and advances in diagnostic techniques propitiated the detection of tumors in the early stages, leading to a better understanding of HCC’s natural history. Didactically, natural history can be divided into three phases: molecular, preclinical, and clinical [45].
2.2.1 Molecular Phase
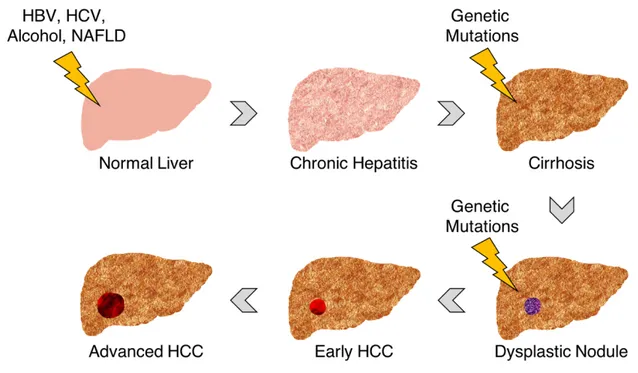
The molecular phase involves several sequential genomic alterations, leading to malignant transformations of the hepatocytes, biliary epithelial, or stem cells [45, 46] (Figure 2.4). These genomic mutations take place over the years, in a setting of continuous liver injury and regeneration, promoting proliferation and inhibiting apoptosis [45]. As a result, single or multiple dysplastic nodules are formed. Further genetic alterations arise in these nodules, leading to the full development of HCC.
Figure 2.4 Schematic representation of HCC’s natural history. HBV = hepatitis B
virus, HCC = hepatocellular carcinoma, HCV = hepatitis C virus, NAFLD = non-alcoholic fatty liver disease.
2.2.2 Preclinical Phase
The preclinical phase represents two distinct but continuous periods. In the first period (prediagnostic period), the tumor is present but still too small to be diagnosed by imaging techniques. As the tumor grows, it reaches a size threshold for imaging detection, around 1 cm to 2 cm (diagnostic period) [45]. In both periods, the tumor remains silent, characterizing the preclinical phase. Surveillance efforts are directed to
undergoing one of these treatments ranges from 30% to 80%, versus a 5-year survival of less than 5% among those who are not eligible for treatment [15, 24, 47-52].
2.2.3 Clinical Phase
The tumor becomes symptomatic only when it reaches 4.5 cm to 8 cm [36, 45, 53]. Before that, patients may experience symptoms associated with their chronic liver disease. HCC is an important differential diagnosis among patients with compensated cirrhotic who progress to decompensation, manifested by ascites, encephalopathy, jaundice, or variceal bleeding [54]. Furthermore, the presence of upper abdominal pain, weight loss, early satiety, or palpable mass may indicate an advanced tumor [55]. The prognosis for patients at this phase is poor, with a median survival of fewer than six months after the onset of symptoms and no benefit from treatment [52, 56].
2.3 Surveillance and Diagnosis
2.3.1 Principles and Importance of Surveillance
Surveillance can be defined as the systematic use of screening tests to identify the occurrence of a given disease, within an at-risk population, while it is still subclinical [57]. The World Health Organization has created a list of criteria to determine if it is worth it or not to perform surveillance [58]; HCC surveillance meets all of these criteria: HCC has a significant impact on public health, the detection of HCC at an early stage improves outcomes, there are known groups at high risk of developing HCC, tests are
available for surveillance, these tests can detect HCC at an early stage, the tests are cost-effective and acceptable to physicians and patients, an algorithmic approach to recall and diagnosis after the detection of findings is available, and there are effective treatments for confirmed cases of HCC [57].
The reasoning behind HCC surveillance is that patients undergoing this program are associated with early tumor detection (odds ratio [OR] 2.08, 95% confidence interval [CI] 1.80–2.37), curative treatment (OR 2.24, 95% CI 1.99–2.52), and improved survival (OR 1.90, 95% CI 1.67–2.17) [27, 59-61]. Several biases may make the interpretation of HCC surveillance outcomes difficult; these include the lead-time bias (apparent improvement in survival), the prognostic selection bias (identification of patients with slow progressive tumors who are more likely to live longer), and the overdiagnosis bias (false-positive cases). However, authors have shown that the benefits of HCC surveillance persist even after adjustment for lead-time bias [62, 63].
Several liver-study associations have published practice guidelines recommending HCC surveillance [12, 13, 64, 65] (Table 2.1). Despite the presence of slight differences, the overall general approach is similar. In the following topics, we will discuss the recommendations proposed by the North American guidelines [12, 13, 65].
Table 2.1 Surveillance Recommendations According to Different Associations
Organization Target Population Surveillance
Method
Reference
AASLD Cirrhotic patients, non-cirrhotic HBV carriers (Asian male > 40
years, Asian female > 50 years, African or North American blacks, family history
of HCC)
US ± AFP every 6 months
[12]
EASL Cirrhotic patients, non-cirrhotic HBV carriers at intermediate or high risk of HCCa, patients with
severe liver fibrosis
US every 6 months [64]
Canadian Consensus and CASL
Cirrhotic patients, non-cirrhotic HBV carriers (Asian male > 40
years, Asian female > 50 years, African or North American blacks, family history
of HCC)
US every 6 months [13, 65]
AASLD = American Association for the Study of Liver Diseases, CASL = Canadian Association for the Study of the Liver, EASL = European Association for the Study of the Liver, HCC = hepatocellular carcinoma.
2.3.2 At-Risk Patients
To perform surveillance, it is paramount to define subgroups that are at higher risk of developing HCC. The estimated incidence of HCC can indicate the level of risk. However, due to the lack of experimental data, economic analyses were used to determine whether or not, and at which incidence rate, it is cost-effective to perform HCC surveillance [12].
Cost-effectiveness models suggested that the incidence threshold for surveillance efficacy among cirrhotic patients ranges from 1.5% to 2% per year [17, 66, 67]. Using this value, current guidelines recommend performing surveillance in all cirrhotic patients once the diagnosis is made [12, 13, 65]. Patients with cirrhosis secondary to HBV or HCV who have cleared the infection seem to show a decrease in risk. However, since the magnitude of this decrease is difficult to evaluate, it is recommended that these patients continue surveillance [68].
Chronic HBV carriers may also benefit from surveillance if the annual HCC incidence exceeds 0.2% per year [69]. The HCC incidence in Asian patients with HBV starts to exceed 0.2% per year at around 40 years in men and 50 years in women [70-72]. Among Africans or African descendants, the incidence is increased earlier in life; as a consequence, surveillance should begin at the time of HBV diagnosis [73]. Furthermore, chronic HBV carriers with a family history of HCC are also at a higher risk and should undergo surveillance [74].
2.3.3 Surveillance Testing
An ideal surveillance method would have a positive result only if the patient has the disease and a negative result only if the patient does not have the disease [75]. Unfortunately, there is no such ideal method for HCC.
Since the primary purpose of surveillance is to detect potential disease indicators, physicians choose surveillance tests with relatively high rates of sensitivity (true positives in patients with disease), to not miss a possible disease. However, for the same method, a high sensitivity rate means a low specificity (true negative in patients without disease) rate. This relationship is demonstrated by the Receiver Operating Characteristic (ROC) curve (Figure 2.5). The consequence is a higher likelihood of false-positive exams, resulting in unnecessary follow-up tests and their consequences, such as physical and psychological stress and financial expenditures.
Figure 2.5 Receiver Operating Characteristic (ROC) curve. For the same test (blue
curve), the higher the sensitivity (point y) the lower the specificity and the lower the sensitivity (point x) the higher the specificity.
In clinical practice, current North American guidelines recommend US every six months as the surveillance method [12, 13, 65]. US appearance of HCC is variable; furthermore, US is extremely operator dependent. In the gray-scale US, HCC typically presents as hypoechoic nodules [76] (Figure 2.6). However, some lesions may show increased echogenicity due to the inclusion of fatty tissue. Large lesions often put pressure on adjacent vessels and infiltrate the portal vein. They may present with
Figure 2.6 Small hypoechoic nodule in a cirrhotic liver corresponding to
hepatocellular carcinoma (arrow). Reproduced with permission from Carvalho et al. [76].
A recent meta-analysis estimated an US sensitivity of 0.78 (95% CI 0.60–0.89) and specificity of 0.89 (95% CI 0.80–0.94) for detecting HCC in a surveillance setting [78]. However, up to 20% of US examinations in patients with cirrhosis are characterized as inadequate for HCC exclusion [14]. The most common reasons for inadequacy are rib shadowing and insufficient US beam penetration [14].
It is becoming evident that US limitations affect the efficacy of surveillance. Other imaging modalities, such as CT and MRI, are not recommended for routine use; nonetheless, a recent guideline recognizes these options for selected patients [12].
Furthermore, an abbreviated MRI protocol was recently proposed as an acceptable method for HCC surveillance [79-81]. This modality retains the advantages of the MRI, such as high contrast and absence of ionizing radiation, while reducing image acquisition and reading time, resulting in shorter and less expensive exams.
The use of blood biomarkers, such as alpha-fetoprotein (AFP), is considered controversial [65]. The association of AFP with US may improve overall survival [60] and maximize early tumor detection; however, it leads to a higher rate of false positives and an increase in costs [82].
2.3.4 Diagnostic Testing
A surveillance method, with few exceptions, does not aim to diagnose the illness. Thus, patients who test positive typically require further evaluation [75]. In the case of HCC, the diagnosis can be established based on noninvasive imaging, either multiphase CT or MRI, without the need for biopsy confirmation [12, 13, 65].
Figure 2.7 represents the surveillance and diagnostic algorithm recently
proposed by the American Association for the Study of Liver Diseases (AASLD) [12]. According to this algorithm, patients with a positive surveillance (US demonstrating a lesion ≥ 10 mm or AFP ≥ 20 ng/ml) should undergo a diagnostic imaging modality (multiphase CT or MRI). Multiphase CT and MRI are interpreted and reported through the Liver Imaging Reporting and Data System (LI-RADS) [83]. This system is
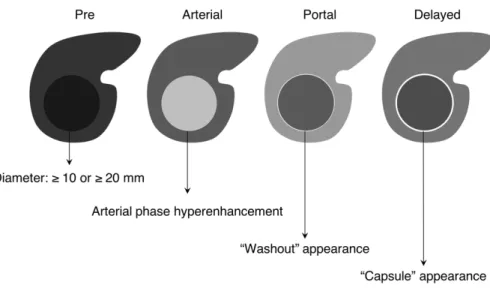
(definitely benign) or 2 (probably benign) should return to surveillance imaging in 6 months. Those with lesion classified as LI-RADS 3 (intermediate) should repeat a diagnostic imaging immediately or in 3 to 6 months. Lesions classified as LI-RADS 4 are highly suspect, and a multidisciplinary discussion regarding the best workup is recommended. An image that is classified as LI-RADS 5 confirms the diagnosis of HCC. To be categorized as LI-RADS 5, the image should satisfy one of the following criteria [85] (Figure 2.8 and Figure 2.9):
• Non-rim arterial phase hyperenhancement AND;
• If lesion 10–19 mm = nonperipheral “washout” OR threshold growth (≥ 50% size increase of a mass in ≤ 6 months) OR nonperipheral “washout” AND enhancing “capsule”;
• If lesion ≥ 20 mm = nonperipheral “washout” OR threshold growth OR enhancing “capsule”.
Figure 2.7 American Association for the Study of Liver Diseases (AASLD)
surveillance and diagnostic algorithm. Reproduced with permission from Marrero et al. [12]. AFP = alpha-fetoprotein, CT = computed tomography, HCC = hepatocellular carcinoma, MRI = magnetic resonance imaging, US = ultrasound.
Figure 2.8 Schematic representation of LI-RADS major criteria for hepatocellular
Figure 2.9 Summary of CT and MRI diagnostic Liver Imaging Reporting and Data
System major features. Reproduced with permission from Chernyak et al. [86]. APHE = arterial phase hyperenhancement, CEUS = contrast-enhanced US, DWI = diffusion-weighted imaging, ECA = extracellular contrast agent.
2.4 Management
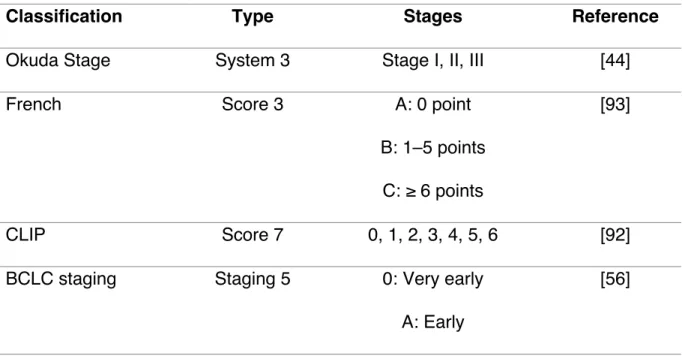
HCC management depends upon the degree of the underlying liver dysfunction and the size of the tumor. The traditional tumor node metastasis (TNM) staging system has shown significant limitations in classifying HCC patients [87, 88]. Several new systems were proposed to address HCC staging [44, 56, 88-93] (Table 2.2), none of them with universal acceptance.
The Barcelona Clinic Liver Cancer Staging (BCLC) system is the most used in clinical practice and is the recommended staging system by North American guidelines [12, 13, 56, 65]. It will be described in the next sections along with the treatment options according to its classification.
Table 2.2 Hepatocellular Carcinoma Staging Systems
Classification Type Stages Reference
Okuda Stage System 3 Stage I, II, III [44]
French Score 3 A: 0 point
B: 1–5 points C: ≥ 6 points
[93]
CLIP Score 7 0, 1, 2, 3, 4, 5, 6 [92]
BCLC staging Staging 5 0: Very early
A: Early
B: Intermediate C: Advanced D: End-stage
CUPI Score 3 Low risk: score ≤ 1
Intermediate: score 2–7 High: score ≥ 8
[91]
TNM staging System 3 Stage I, II, III [88]
JIS Score 4 Stage I, II, III, IV [90]
ER System 2 ER wild-type
ER variant
[89]
BCLC = Barcelona Clinic Liver Cancer Staging, CLIP = Cancer of the Liver Italian Program, CUPI = Chinese University Prognostic Index, ER = estrogen receptor, JIS = Japan Integrated Staging Score, TNM = tumor node metastasis.
2.4.1 Barcelona Clinic Liver Cancer Staging (BCLC)
The BCLC system was designed based on the results of several cohort studies and randomized controlled trials [56, 94, 95]. This system takes into account characteristics related to tumor stage (Okuda staging system, which takes into account the tumor size, the presence of ascites, and the values of albumin and bilirubin), liver
while those classified as Child-Pugh C have severe liver disease [decompensated cirrhosis]), physical status (performance status test [PST], recorded from 0 [fully active] to 5 [dead]), and cancer-related symptoms to classify HCC patients into four categories: early, intermediate, advanced, and terminal (Figure 2.10).
Figure 2.10 Barcelona Clinic Liver Cancer Staging (BCLC) classification and
treatment schedule. Reproduced with permission from Llovet et al. [94]. *Cadaveric liver transplantation or living donor liver transplantation. HCC = hepatocellular carcinoma, PEI = percutaneous ethanol injection, PST = performance status test.
The BCLC has already been validated as the best staging system for patients with early HCC; however, some important limitations have been identified [96, 97]. The main points of disagreement are: (1) the non-inclusion of The Milano/Mazzaferro criteria for liver transplantation (LT) (patients with solitary tumor ≤ 5 cm or up to three tumors all ≤ 3 cm should be considered for LT; with the BCLC system, only some patients with three nodules ≤ 3 cm should undergo LT) [88] and (2) the non-consideration of liver resection as a treatment option for some subgroups of patients who may benefit from this approach (including some patients with early and intermediate-stage HCC) [98].
2.4.2 Early-Stage HCC (BCLC 0-A)
This category is comprised of patients who are eligible for potentially curative therapies, including liver resection, LT, and radiofrequency ablation (RFA).
Liver resection remains the optimal treatment for HCC in patients with normal liver function; however, the efficacy depends on the ability to achieve a complete resection that leaves an adequate liver remnant [37]. Furthermore, since the liver remnant may maintain precancerous disease, the recurrence is possible [99, 100].
The recurrence after LT is less frequent compared to liver resection [99, 100]. However, this advantage is counterbalanced by the long-term complications associated with transplants, such as graft rejection and immunosuppression [37]. Furthermore, the
During this period, the risk of tumor progression and dropout may be as high as 25% [101].
RFA is based on the use of a high-frequency alternating current transferred from the tip of an electrode into the tissue. The oscillating current induces movement of the ions within the tissue, resulting in frictional heating. When the temperature surpasses 60°C, the cells surrounding the electrode begin to die, generating necrosis. RFA is an alternative to liver resection, especially if the lesion is solitary and small [102]. It can also be used as a bridge therapy in patients waiting for LT, resulting in a decrease in the dropout rate secondary to tumor progression [103].
2.4.3 Intermediate-Stage HCC (BCLC B)
Patients at this stage are eligible for transarterial chemoembolization (TACE). This approach is based on the fact that HCC > 2 cm has a blood supply derived from the hepatic artery. The injection of a chemotherapeutic agent produces arterial embolization, resulting in ischemia and necrosis of the tumor. However, TACE is not considered a curative therapy [104, 105]. The therapy outcome depends on the initial tumor burden, tumor biology, baseline hepatic function, and the initial response [37]. Primarily, TACE therapy aims to extend overall survival and avoid dropout of patients on the waiting list for LT [104, 106].
2.4.4 Advanced-Stage HCC (BCLC C)
Patients with advanced-stage HCC should undergo systemic therapy. To date, sorafenib is the only agent that demonstrated a statistically significant, although
modest, survival benefit [107, 108]. The sorafenib molecule is a multikinase inhibitor; it acts by inhibiting the cellular proliferation and the angiogenesis.
2.4.5 End-Stage HCC (BCLC D)
These patients have a dismal prognostic, with a median survival of less than 3 to 4 months [52]. At this point, patients should receive palliative support, including management of pain, nutrition, and psychological support [109].
3
Economic Analysis in Health Care
3.1 Introduction to Economic Analysis
New health technologies or medications in health care may offer an increase in desirable outcomes when compared with the current practices. However, these options are typically more expensive when newly introduced. Economic analysis in health care aims to evaluate if the additional benefit of an intervention is compensated by the increase in cost through answering the following question: are we satisfied that the health resources should be spent in this way rather than in some other ways? [11]. Economic analysis is considered an important tool in public health, mainly because of the limitations in health care budgets and the increase in health expenditures [110] (Figure 3.1).
Figure 3.1 Health care cost in selected countries as a percentage of gross domestic
product. Data extracted from the World Health Organization Global Health Expenditure Database [110]. GDP = gross domestic product.
Physicians could consider that letting cost influence clinical decisions or policies is unethical [111]. However, in health economics, the term “cost” has more than a simple monetary connotation. It represents the loss of potential benefits when one intervention is chosen over another, called the “opportunity cost.” For example, imagine that the directors of a hospital have Can$1,000,000 (Canadian dollars) to spend. They could use the money to build an operating room or to buy a new MRI machine. The
0 2 4 6 8 10 12 14 16 18 2000 2005 2010 2017
% GDP
Year
Health Care Cost (2000 to 2017)
Australia Canada France Japan
diagnostics that were not performed, if the directors had preferred to build the operating room, is the opportunity cost. This concept is linked to the notion of scarcity of resources. If there is no scarcity, there is no opportunity cost.
At the patient level, economic analysis is also important. By taking into consideration the relationship between benefits and costs, physicians can ensure the best possible care for their patients while respecting the responsible allocation of public resources [112]. It is essential to underline that economic analysis should not be the only criteria for deciding which alternative to choose; patients preferences and physicians experience should also be considered [113]. However, it can be another source of information when physicians discuss management options with patients and colleagues. In the following sections, a basic description of economic analysis will be presented. The understanding of these sections will hopefully help physicians to incorporate economic concepts into their practice.
3.2 Types of Economic Analysis
3.2.1 Cost-Effectiveness Analysis (CEA)
The CEA is characterized by the measurement of gains in natural units of health, such as cures, lives saved, or decrease in blood glucose or blood pressure. The results of such analyses are given in terms cost per unit of outcome (for example, Can$5,000 per cure). However, given that the outcomes of different technologies can be measured in different units (for example mmol/L for blood glucose or mmHg for blood pressure),
the CEA permits the comparison of two or more interventions only if the same units are used, which limits the application of this category of analysis. Further, it may be difficult for decision-makers to establish a willingness-to-pay (WTP) for such outcomes.
3.2.2 Cost-Utility Analysis (CUA)
The CUA is considered by some authors to be a subdivision of CEA [114]. The major difference between these economic analyses is that the CUA measures its health outcomes in a single generic unit, called quality-adjusted life year (QALY). The construction of this unit is based on patients’ preferences according to the quality and the quantity of life [115] (see Measurement of Health below). Despite some limitations, especially regarding the subjectivity of how “quality” can be measured [116], the CUA is recommended as the most valuable economic analysis, since it allows comparisons across different conditions and interventions [117].
3.2.3 Cost-Benefit Analysis (CBA)
In the CBA analysis, costs and benefits are valued in monetary units. Differently, to the CEA and CUA, which aim to identify what is the best option to apply an existing budget, CBA answers whether or not it is worth to spending it [11]. Although popular in other fields, CBA is not commonly used in the health context due to ethical issues and difficulties related to measuring benefits in monetary terms [117].
interventions evaluated is the only difference, and the intervention with the lowest-cost is considered the preference. Generally, a CMA is realized when the analysis of treatments tested in clinical trials results in non-inferiority or equivalence. Some authors consider that the CMA is a cost analysis rather than a complete economic analysis [114].
3.3 Choosing the Population and Comparators
While developing an economic analysis, researchers should define the target population and the comparators, since the cost-effectiveness of intervention could extensively vary according to both factors. The decision problem should be guided by the choice of population and comparators, being that it is considered good practice to consider the opinions of physicians and decision-makers [117].
To address the study objectives, an economic model should reflect the entire target population. However, important heterogeneities may be present inside a large group, such as the Canadian population. In this case, the researchers should identify which differences could play an essential role in the model development (for example, differences in the natural history of the studied disease or the effectiveness of interventions), in order to incorporate different parameter values according to distinct subgroups [118, 119].
The selection of comparators is also of the highest importance. Based on the Canadian Guidelines for the Economic Evaluation of Health Technologies, the most
appropriate comparators are the standard of care (i.e. the interventions currently used in the Canadian context) and the technologies that are likely to be displaced by the intervention under investigation. Furthermore, considerations regarding the best supportive care should be made when new technologies are not fully adopted or represent uncertain value [117]. In principle, the comparators should be mutually exclusive (a patient with a given condition can only receive one intervention) [11]. They should be clearly described to allow for the identification of all relevant costs and outcomes [117].
3.4 Perspective
The perspective of an economic analysis should be related to the decision problem and consistent with both costs and outcomes. There are different possibilities of perspective (societal, public health payer, and private health payer) and costs and outcomes that are important from a given perspective may not be from another [11] (Table 3.1).
Because health economics is a science concerned with society’s welfare, some authors argue that economic analysis should preferably evaluate technologies from the societal perspective [120, 121]. The societal perspective is also considered to be the broadest approach since it incorporates all possible costs. Nevertheless, the
Table 3.1 Relevant Costs According to Different Perspectives
Perspectives and Costs Societal Public Health
Payer
Private Health Payer
Health Sector YES YES YES
Other Sectors YES YESa –
Patients and Families YES – –
Loss of Productivity YES – YESb
aThe public sector may also consider services others than the health services (broader
government payer perspective). In this case, costs related to other sectors should also be considered [117].
bDespite the Canadian guideline does not consider the loss of productivity as a relevant
cost under the private health payer perspective [117], we understand that costs linked to loss of productivity due to reduced working capacity or costs to hire and train a replacement worker may be relevant to the private sector.
3.5 Time Horizon
The time horizon is also relevant in economic analysis. It depends on the decision problem and can range from a few weeks to a lifetime period, according to the natural history of the condition [117, 122]. When modeling chronic diseases or when the interventions have an impact on mortality, for example, a lifetime horizon is most appropriate [117]. In all cases, the time horizon should be long enough to capture all
significant differences between costs and outcomes of the evaluated interventions [123].
An inappropriately short time horizon can bias the results and compromise the analysis, as it may capture only a fraction of the costs and utilities associated with a given condition. For example, if one considers the cost and utility at the time “t2”, only a portion of the utility would be captured, while the cost already reached its plateau. At this point, an economic analysis could state that the intervention would not be cost-effective. Comparing the points “t2” and “t4” it is possible to observe that in the last one there is an increase in the utility value, while the cost stays almost the same, changing the cost-effectiveness relation (Figure 3.2).
3.6 Measurement of Costs
Drummond et al. [11] classified costs as: associated with the health sector, associated with other sectors (such as education and housing), paid for by patients and families (such as transportation and feeding), and related to loss of productivity. Economic evaluations may incorporate one or more of these costs, according to their perspectives.
3.6.1 Costs versus Time (Adjusting and Discounting)
Even when costs have the same monetary unit, they may not be comparable because of changes in price over time. To compensate for this effect, costs should be corrected by using the concepts of adjusting and discounting.
When using costs from the past, it is necessary to adjust them to the present. This can be done by multiplying the costs by the accumulated inflation of the period. Inflation is a key concept in economic studies, it represents the increase in prices over time and, consequently, the loss of purchasing power (for example, Can$1,000 in 2000 purchased a higher percentage of goods or services than in 2017) (Figure 3.3). The decrease in prices (deflation) is also possible, but less common than inflation.
Figure 3.3 Schematic representation of loss of purchasing power in Canada. Data
extracted from the Bank of Canada [124].
Similarly, economic evaluations that involve costs in the future require the application of a discount rate to reflect individuals' and society’s preferences over time. Discounting makes present costs worth more than those occurring in the future. This is justified by the fact that individuals and society generally prefer to buy goods (i.e., equipment or procedures) and enjoy benefits in the present rather than wait for the future.
The principle of discounting is essential when evaluating health interventions where financial resources are consumed in the present while health benefits occur in the future [125]. The discounting rate changes according to society’s preferences; in
0 100 200 300 400 500 600 700 800 900 1000 2000 2005 2010 2017 P u rch a se P o w e r (C $ ) Year
Loss of Purchasing Power in Canada (2000 to 2017)
0% 10% 20% 30% 40% 50% 60% 70% 80% 90% 100%
Global High SDI Middle SDI Low SDI
P u rch a se P o w e r (C a n $ ) Selected Regions
Distribution of HCC-Related Deaths by Risk Factor (2015)
Canada, the recommended discounting rate is 1.5% per year [117]. As well as costs, outcomes should also be discounted [117].
3.6.2 Cost Estimation
When evaluating which sources to consider, the authors of economic evaluations should always reflect the jurisdiction of interest. Where important variations exist within the jurisdiction, the author should consider them when conducting the evaluation [117].
Micro-costing is considered the most accurate method to estimate the costs of a given intervention [11]. It involves the enumeration and the costing of every input of the technology that is being evaluated [126]. Other costs used in economic analysis are usually derived from government or private sector sources, or even from previous economic analyses. However, it is always important to highlight that the selected costs depend primarily on the perspective of the study.
3.7 Measurement of Health
In economic studies, the health outcomes can be measured according to the study objective (for example, number of days free of symptoms after the use of a new bronchodilator in asthmatic patients) and the type of economic analysis. Since this thesis is based on a cost-utility analysis, the following topics will explain how to measure health outcomes in this type of analysis.
3.7.1 The Concept of Utility
As already mentioned, health economists created the concept of QALY to enable comparisons across a broader area of health care interventions. This outcome aims to summarize in a single measurement the impact of an intervention on the patient’s quality and quantity of life. To generate QALYs, it is necessary to establish which are the health states of interest (for example, HCV infection, compensated cirrhosis, decompensated cirrhosis, and HCC) and value the preference associated with each one of these states [115].
These qualities of life weights are called utilities and represent the general population’s preferences for a specific health condition. Generally, a health condition is described for a healthy group of people, which represents the society (societal point of view), and it is valued from 0 (death) to 1 (perfect health) [115]. It is important to mention that utilities may also be measured considering patients and caregivers preferences. Furthermore, differences among populations and methods may influence health state valuation [127]. In the next paragraphs, three well-established methods to directly measure utilities will be described. There are also indirect methods to measure utilities (see The Concept of Health-Related Quality of Life below).
• Time trade-off: this method estimates preferences by asking participants to imagine two distinct situations (Figure 3.4): perfect health (situation 1) for a shorter time (t1) and imperfect health (situation 2) for a longer time
indifferent between the shorter period of perfect health (t1) and the longer
period of imperfect health (t2). The utility is calculated by dividing t1 by t2
[114].
Figure 3.4 Schematic representation of the time trade-off method.
• Standard gamble: participants should choose between the certainty of remaining in an imperfect state of health chronically (situation 1) or gamble between re-establishing perfect health (probability p) or progress to death (probability 1-p) (situation 2) [115] (Figure 3.5). Then, participants have to indicate the probability “p” in which they are indifferent between the certainty and the hazard. The chronic health state utility is equal to the value of the probability “p.”
Figure 3.5 Schematic representation of the standard gamble method.
• Visual analogue scale: this method is constituted of a single line on a page with verbal and numerical descriptions at each end [128] (Figure
3.6). The top of the scale represents perfect health while the bottom
indicates death, participants are asked to select a point between these two values according to their preferences. The visual analogue scale is the simplest method, usually used as a “warm-up” exercise before other methods [115].
Figure 3.6 Schematic representation of visual analogue scale method.
3.7.2 The Concept of Health-Related Quality of Life (HRQoL)
Another methodology of assessing the quality of life is by applying HRQoL surveys. These instruments evaluate the patients’ perspective and, usually, do not establish a general score. Instead, they produce multiple scores in different health dimensions, such as physical and social functioning, pain, and mental health [129]. Furthermore, it is possible for a given treatment to be superior in one health dimension and inferior in another. These aspects limit the application of HRQoL surveys in economic analysis [114].
To address these limitations, health economists concentrated their efforts in developing mathematical algorithms to summarize HRQoL multiple scores in one general score [130]. Given the complexity associated with directly measuring health utilities (i.e. time trade-off, standard gamble), it is recommended that researchers use utilities from an indirect method of measurement, such as the EQ-5D [117, 131].
The EQ-5D is a preference-based HRQoL instrument which evaluates the generic quality of life [132]. It is widely used in patient-reported outcome exercises, in population health studies, and in health technology assessment [131]. The EQ-5D instrument comprises five dimensions: mobility, self-care, usual activities, pain/discomfort, and anxiety/depression. The scores on these five dimensions can be converted to generate one summary score, varying from 0 to 1, while evaluating the different dimensions [133].
3.7.3 The Concept of Quality-Adjusted Life Year (QALY)
QALYs are calculated by multiplying the utilities (quality weights) of each health state of interest by the duration of time spent in each state. For example, a patient that lives 2 years with decompensated cirrhosis (patient A, utility equals 0.6) will have a total of 1.2 QALYs, while a patient with decompensated cirrhosis who is submitted to a LT (patient B, utility equals 0.85) lives 10 years and will have a total of 8.5 QALYs (Figure
3.7). In this case, the LT added 7.3 QALYs (cross-hatched area) during the patient’s B
Figure 3.7 Schematic representation of quality-adjusted life year for a patient with
decompensated cirrhosis (patient A) and decompensated cirrhosis submitted to a LT (patient B).
As well as costs discounting, outcomes (in this case QALYs) should also be discounted (see Measurement of Costs above). Costs and outcomes are usually discounted at a constant common rate (1.5% per year in Canada) [117].
3.8 Decision Analysis (Modeling)
The conceptualization of a model is a critical component when developing an economic analysis. Modeling can be useful by extending the results of clinical trials, extrapolating intermediate clinical endpoints to final outcomes, and comparing different health technologies [134]. Different modeling techniques are used in economic analysis, including the decision tree, Markov modeling, and the discrete event simulation.