2002-05 THE METROPOLITANISATION OF CANADA. WHY POPULATIONS CONTINUE TO CONCENTRATE IN AND AROUND LARGE
URBAN CENTRES AND WHAT IT MEANS FOR OTHER REGIONS
Mario POLÈSE et
Richard SHEARMUR
INRS Urbanisation,
Culture et Société
Septembre 20033465, rue Durocher Montréal, Québec
THE METROPOLITANISATION OF CANADA.
WHY POPULATIONS CONTINUE TO CONCENTRATE
IN AND AROUND LARGE URBAN CENTRES
AND WHAT IT MEANS FOR OTHER REGIONS
Mario POLÈSE and Richard SHEARMUR
Institut national de la recherche scientifique Urbanisation, Culture et Société
3465 Durocher Montreal (Quebec) H2X 2C6
I
NTRODUCTION:
T
HER
ISE OFM
ETROPOLITANC
ANADA 1Like other industrialized nations, Canada has undergone a long phase of urbanisation, and is today an overwhelmingly urban nation (Figure 1). Some 80% of Canadians now live in urban areas as defined by Statistics Canada. As in other “advanced” nations, the rate of urbanisation is levelling off (as it eventually must) and will, in all likelihood, stabilize in the 85%-90% range. However, Canada’s geography and historically resource-based economy has given rise to a more dispersed settlement pattern than in most other nations (certainly, compared to most Western European nations) with a broad spectrum of urban areas of various sizes, often located at great distances from each other. The resource-based economy often produced urban settlements whose sole reason for existence was the exploitation (or primary transformation) of a particular resource, be it fish, wood, wheat, hydro-electrical power, minerals, natural gas or petrol. We need only point to the logging, mining, and smelting towns of Northern Ontario and Northern (and Eastern) Quebec. An urban agglomeration such as Chicoutimi, with a population over 100,000 2, owes its existence almost entirely
to the forest (pulp and paper mills) and to hydro-electrical power (aluminium smelting). However, as elsewhere, Canada’s urban system has come to be dominated by a few large metropolitan areas, home to the chief financial, corporate, and cultural institutions. Some 37% of Canada’s population lived in the four largest metropolitan areas (CMAs) in 2001: Toronto, Montreal, Vancouver, Ottawa-Hull 3, each with a
population of over one million. The percentage rises to over 50% when we add CMAs with populations over 500,000. As Figure 2 shows, the percentage is on the rise, with an acceleration since 1991. The percentages are even higher if we consider employment
1 The authors should like to thank the Social Sciences and Humanities Research Council of Canada
(SSHRC), the Atlantic Canada Opportunities Agency (ACOA) and Economic Development Canada (for Quebec Regions) for their financial assistance. The authors are titleholders of Canada Research Chairs, respectively, in Urban and Regional Studies and in Spatial statistics and Public Policy. The opinions expressed here are the sole responsibility of the authors.
2 The term urban agglomeration, as used here, corresponds to Statistics Canada definitions. That is, they
refer to integrated functional urban areas whose boundaries are largely defined by their respective commuting sheds. The terms employed by Statistics Canada are Census Metropolitan Areas (CMAs) for larger agglomerations and Census Agglomerations (CAs) for smaller agglomerations. These definitions are consistent with international usage. Canadian CMAs are, for example, equivalent to MSAs (Metropolitan Statistical Areas) in the United States. Agglomerations should not be confused with cities or municipalities, which are administrative units. A CMA is generally comprised of various municipalities. The terms urban agglomeration and urban area are used as synonyms. However, we shall also sometimes employ the word city in its generic sense, as a synonym for agglomeration or urban area.
3 The proper name for the Ottawa-Hull metropolitan area since 2002 is Ottawa-Gatineau as a result of a
new merged city (including Hull) on the Quebec side of the Ottawa River. Following a local referendum, the name Gatineau was chosen for the new amalgamated city.
Figure 1 - Percentage of Canadian population living in urban areas, 1851 - 2001 0% 10% 20% 30% 40% 50% 60% 70% 80% 90% 1850 1870 1890 1910 1930 1950 1970 1990 2010 Year
Sources: TCE (2001); World Bank (2002)
Figure 2 - Percentage of Canadian population living in metropolitan areas having over 500,000 inhabitants, 1971- 2001 40% 42% 44% 46% 48% 50% 52% 1971 1981 1991 2001 Year
50,5% 51,0% 51,5% 52,0% 52,5% 53,0% 53,5% 1991 2001 Year
Figure 3 - Percentage of Canadian employment in metropolitan areas having over 500,000 inhabitants, 1991 and 2001
Source: Statistics Canada (2002)
(Figure 3), a reflection in turn of higher labour force participation rates and lower employment rates in large metropolitan areas (Statistics Canada, 2002). Differences in the spatial distribution of job opportunities are the driving force behind metropolitani-sation, which brings us back to the importance of geography and location.
It is not impossible that one day close to 60% of Canada’s population will reside in a few large metropolitan areas (with populations over 500,000). This gradual population shift towards large metropolitan areas is a reflection of Canada’s changing economy. As Canada’s economy becomes less and less dependent on resource exploitation, its structure is coming to resemble that of other industrialized nations, increasingly dominated by tradable services and high value-added manufacturing. Such activities tend to cluster in and around the largest urban centres, a point to which we shall return. Canada’s economic geography is undergoing a slow but steady transformation as its economy is progressively organized around a few large urban centres. This is what we mean by the metropolitanisation of Canada. The transformation is not limited to the concentration of economic activity in metropolitan areas (CMAs) as such, but also in communities (of various sized) near the largest metropolitan areas, as we shall see in the following sections.
The corollary of this transformation is that communities beyond easy range of a major metropolis, communities often initially founded on resource exploitation, are finding it increasingly difficult to sustain their economies. It is this parallel evolution (metropolitanisation on the one hand, a progressively fragile periphery on the other) that
we shall explore in the next sections. Canada’s geography, with its great distances and sparsely settled expanses, means that many small and middle-sized urban areas are evolving in “peripheral” environments quite different from that of more compact and densely settled regions. As we shall attempt to explain, technological change, demographics, NAFTA, and new limits to natural resource exploitation have all contributed to the metropolitanisation of Canada and, by the same token, to the growing vulnerability of the Canada’s non-metropolitan areas. In the conclusion, we shall consider some political and policy implications, from the perspective both of evolving centre-periphery tensions (within Canada) and the governance of extended metropolitan dominated regions. Much of our analysis draws on Polèse and Shearmur (2002), to which the reader is referred for greater detail.
A
NA
LTERNATIVEP
ERSPECTIVE ON THEC
ENTRE-P
ERIPHERYD
IVIDEExcept for the previous section (Figures 1, 2 and 3) the data presented are based on a special Statistics Canada compilation (for INRS Urbanisation, Culture et Société), based on previous censuses, which allows us to analyze information over time for geographically homogeneous units. The geography used (i.e. CMA and CA boundaries) is that of 1991. At the time of writing, compatible information was not yet available for the 2001 census. Our time series analysis thus ends with the 1996 census. However, the preliminary results of the 2001 census suggest that the trends observed here have continued beyond 1996.
We have divided Canada into what we shall call Central and Peripheral locations. In the Canadian context, peripheral regions can be defined in two ways: 1) in comparison to what has been traditionally called “Central Canada” (Ontario and Quebec) and still is by many residents outside those two provinces: 2) in comparison to major urban centres and their surrounding regions; that is, with respect to regions that lack a large urban centre and are distant from major markets. Here, the second definition is applied. Peripheral or “non-metropolitan” regions are thus defined as those located at some distance from large metropolitan areas.
The dividing line between central and peripheral locations was first applied by Coffey and Polèse (1988) and has since shown itself to be very robust. Other studies based on the same framework are Coffey and Shearmur (1996) and Polèse and Champagne (1999). Canada is divided into central and peripheral locations on the basis of urban size and distance. Central locations include all CMAs with populations of 500,000 or over in 1996, as well as other urban and rural areas that fall into approximately one hour’s driving time. All locations that are more than one hour’s drive from a major metropolis are thus classified as peripheral. It should be noted that the 500,000 cut-off point is an analytical device, and not a value judgement on the nature of
Canadian urban areas. Thus, CMAs with populations under 500,000 can often fulfill metropolitan functions within their regional context; urban areas such as Saskatoon and Halifax immediately spring to mind. However, in purely quantitative terms a clear break exists between the two classes4.
The one-hour threshold represents the immediate market areas of large metropolitan areas for professional and other business services5. It measures the radius within which interaction with the metropolis remains fairly easy, a point to which we shall return. Using this benchmark, approximately 72% of all Canadians lived within an hour’s drive of a major metropolis (with populations of 500,000 or more) in 1996, and are thus classified as living in “central” areas (Figure 4). This way of classifying the population puts a different perspective on Canada’s urban reality; the vast majority Canadians today live in locations whose economy and way of life are tightly linked to major metropolitan centres. As Figure 4 clearly demonstrates, the share of the Canadian population falling within this metropolitan shadow has been steadily growing over the last twenty-five years. The percentage is probably close to 75% today.
T
WOS
OLITUDES:
T
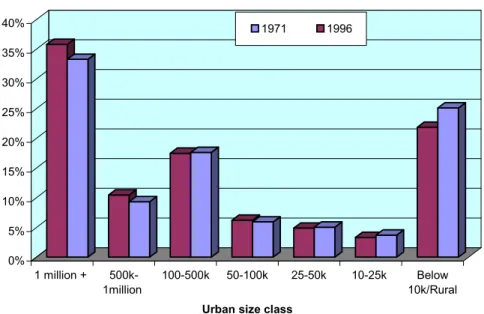
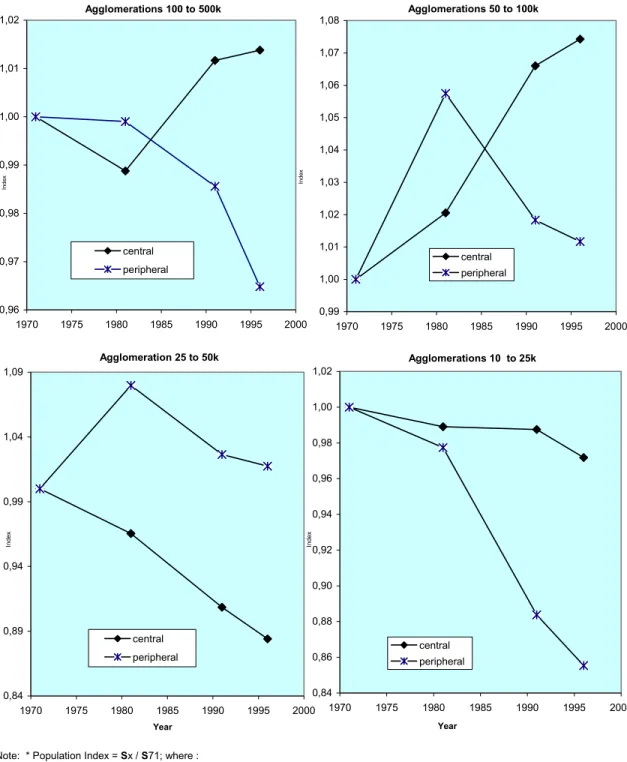
HOSE THAT ARE CLOSE AND THOSE THAT ARE NOTFigure 5 confirms, in greater detail, what was noted in the previous section. The Canadian population is shifting out of rural areas and small communities towards large metropolitan areas. However, once we introduce the centre-periphery dichotomy, we see that the shift is not simply a matter of urban size. Location matters. Figure 6 compares relative shifts in population shares for urban areas in the same size classes in peripheral and central locations. In all cases except one (the 25 to 50k class), population shifts have favoured central locations. That is, for a given size class, urban areas within an hour’s range of a large metropolis have a generally grown faster (or declined less) than comparable cities located at a greater distance. This trend has accelerated since 1981, marking a (negative) turnaround for some peripheral urban areas, which helps to explain the apparent anomaly of the 25-50k class. Peripheral urban areas in the 25-50k and 50-100k class include resource-based communities, notably in Alberta and Northern Quebec, which witnessed a boom during the 1970’s, based largely on petrol and mining, only to witness an abrupt “bust” during the 1980’s.
4 On the basis of the 1996 census, Quebec City was the largest CMA in the second (metropolitan) size
class (671,889), followed by Winnipeg (667,209). In the third size class, the largest urban areas (lying outside the one hour threshold and thus classified as “peripheral”) are Halifax (333, 518) and Victoria (304,287); thus, with populations about half that (or less) of the preceding class.
5 Statistics Canada recently introduced a similar concept, “Metropolitan Influence Zones” (MIZ), to
address the growing integration between large urban agglomerations and their surrounding areas (McNiven et al, 2000).
68,1% 31,9% 68,6% 31,4% 70,9% 29,1% 71,6% 28,4% 10% 20% 30% 40% 50% 60% 70% 80% 1971 1981 1991 1996
* Central regions are locations within a one-hour travel-time radius of a metropolis of 500,000 or more.
Figure 4 - Percentage distribution of Canadian population between central* and peripheral locations, 1971-1996 Central * Peripheral Year 0% 5% 10% 15% 20% 25% 30% 35% 40% 1 million + 500k-1million 100-500k 50-100k 25-50k 10-25k Below 10k/Rural Urban size class
Figure 5 - Percentage distribution of Canadian population among urban size classes, 1971 and 1996
1971 1996
Note: * Population Index = Sx / S71; where : Sx=Percentage of Canadian population, year X S71=Percentage of Canadian population, 1971
Figure 6 - Evolution of population index* by urban size class: Peripheral and central urban areas, 1971-1996
Agglomerations 100 to 500k 0,96 0,97 0,98 0,99 1,00 1,01 1,02 1970 1975 1980 1985 1990 1995 2000 central peripheral Index In dex Agglomerations 50 to 100k 0,99 1,00 1,01 1,02 1,03 1,04 1,05 1,06 1,07 1,08 1970 1975 1980 1985 1990 1995 2000 central peripheral Agglomeration 25 to 50k 0,84 0,89 0,94 0,99 1,04 1,09 1970 1975 1980 1985 1990 1995 2000 central peripheral Index Index Agglomerations 10 to 25k 0,84 0,86 0,88 0,90 0,92 0,94 0,96 0,98 1,00 1,02 1970 1975 1980 1985 1990 1995 2000 central peripheral Year Year
Both classes went from a positive to a negative shift between 1971-1981 and 1981-1991. Thus, the 25-50k peripheral class, after an initial upsurge before 1981, is now declining at approximately the same rate as comparable urban areas in central locations.
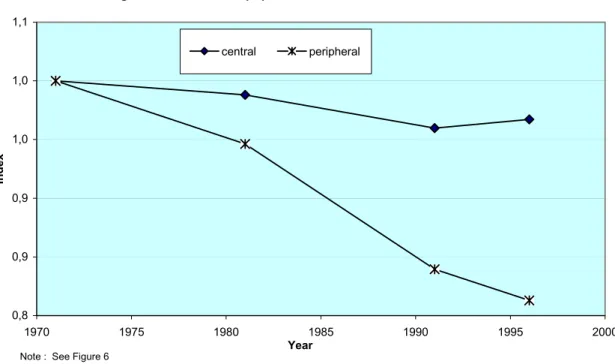
The relative decline since 1981 of smaller urban areas (below 50,000), both peripheral and central, indicates that the observed changes are driven both by location and urban size factors. The greatest positive shifts have been for medium-sized cities (in the 100-500k and 50-100k classes) located within an hour’s range of a large metropolis; while the most dramatic negative shift has been for small (10 to 25k) communities located beyond the one hour limit. Visibly, it helps to be big and close. Small and distant communities are clearly evolving in very different environments from larger urban areas located close to major markets. The division between “close” and “far” is perhaps best illustrated by the evolution of rural communities (i.e. populations below 10,000) whose population, although in relative decline, still accounts for a significant share of the Canadian total (recall Figure 5). The shift out of rural areas has affected distant (i.e. peripheral) communities much more than those located close to a major metropolis (Figure 7).
Indeed, central rural communities appear to be witnessing a positive shift since 1991. In other words, “rural” areas close to a major metropolis are often doing quite well. In many cases, one might reasonably question if these are still “rural” communities in the traditionally understood sense of the term. The face of “rural” Canada is changing. Increasingly, “rural” Canadians are also “metropolitan” Canadians (Figure 8), which may seem a contradiction in terms, but is not once one considers the impact of distance and geography.
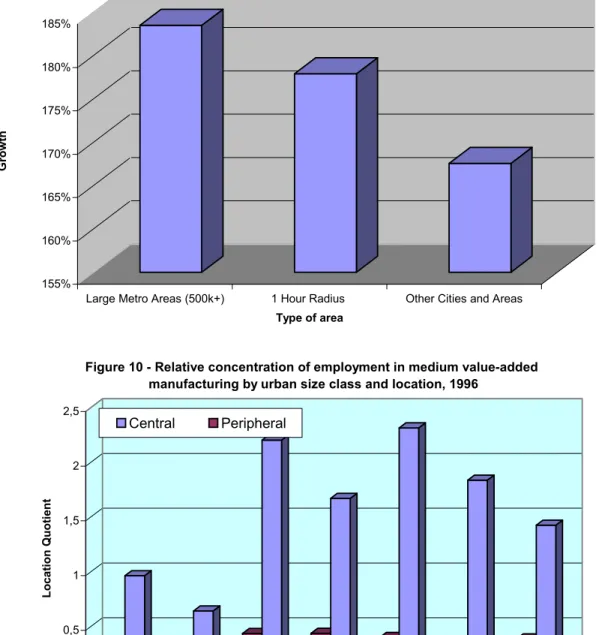
Figure 9 nicely sums up, using employment date this time, the shift first to large metropolitan areas, then to the areas surrounding them, and finally to more “peripheral” locations. Let us now examine, in greater detail, why economic activities (and thus also populations) are increasingly coalescing around large metropolitan areas. The advantages of “being close” plays out at various levels. We shall begin with manufacturing.
Figure 7 - Evolution of population Index : Rural areas, 1971-1996 0,8 0,9 0,9 1,0 1,0 1,1 1970 1975 1980 1985 1990 1995 2000
Note : See Figure 6
In
d
ex
central peripheral
Year
Figure 8 - Percentage of rural population living within a one-hour travel time radius of a major metroplitan area, 1971-1996
37% 38% 38% 39% 39% 40% 40% 41% 41% 42% 42% 1970 1975 1980 1985 1990 1995 2000
Note: Rural areas include all communities with populations below 10,000
Sha
re
The importance of being close ― 1: Industrial location
As in all industrialized nations, space-extensive manufacturing activities in Canada have been moving out of large urban areas to smaller cities; this is a universal trend (Henderson, 1997; Ingram, 1998). Larger cities mean higher wages and higher land prices, as well as congestion costs and other inconveniences associated with size. Certain activities will thus seek out locations where land prices and wages are lower. This has generally been the case for medium value added manufacturing: transportation equipment and vehicles, electronics, plastics, etc. These sectors are sensitive to land prices because they require large industrial lots to operate and do not necessarily require a highly sophisticated or diversified labour force. They will thus often prefer smaller-sized cities. Low value added activities that are a sensitive to labour costs, such as textiles and clothing, will often also prefer small cities were wages are lowest. In essence, as large urban centres increasingly specialize in advanced services and other information-rich activities, manufacturing is being pushed out to less costly locations. This phenomenon is sometimes referred to as “crowding out” (Graham and Spence, 1997).
In Canada, medium value-added manufacturing activities are, as expected, relatively more present in smaller cities than in larger urban centres (Figure 10). However, this industrial deconcentration takes place within a constrained geographic radius6. Many industries do deconcentrate, but they also seek locations that permit
them to stay in close touch with a large metropolis. The reasons for this search for proximity are many, including input-output trading relationships and access to transportation infrastructures (airports, harbours, etc.), but the weight of face-to-face business meetings should not be underestimated. The need for meetings and contacts of all kinds (suppliers, customers, technical, consulting, marketing, repair, etc.) remains a major business cost, and will probably grow as the knowledge content of products increases (Gaspar and Glaeser, 1998).
6 The index of relative concentration used in Figures 10, 11 and 12 is the “location quotient”, a standard
measure of spatial concentration. As used here, the quotient compares the percent of employment in sector x in a given region to the national average. Thus, an index of 2.0 means that employment in sector x is twice as prevalent in the region than the Canadian average. For details, see Polèse and
155% 160% 165% 170% 175% 180% 185% Growt h
Large Metro Areas (500k+) 1 Hour Radius Other Cities and Areas Type of area
Figure 9 - Employment growth by type of area, 1971-1996
0 0,5 1 1,5 2 2,5 Lo ca ti on Quot ie nt 1Million + 500k-1Million 100-499k 50-99k 25-49k 10-24k Rural
Urban size class
Figure 10 - Relative concentration of employment in medium value-added manufacturing by urban size class and location, 1996
Central Peripheral
For much of middle-range manufacturing industry, proximity to a large metropolis remains an essential location criterion. In this game, it is small and medium-sized cities such Brantford, Cambridge, and St.Catharines (all within easy reach of Toronto) who are the winners. Comparable examples in Quebec would be St.Jean and Granby, all within easy reach of Montreal, or Montmagny and Sainte-Marie-de-Beauce, both within an hour’s drive of Quebec City.
The importance of proximity and agglomeration is even greater for high-tech manufacturing. In Canada, as elsewhere, high-tech manufacturing tends to cluster in and around the largest urban centres. As Figure 11 illustrates, high-tech manufacturing is almost totally absent beyond the one-hour metropolitan radius. The reasons for the spatial clustering of high-tech activities, and of information-rich activities in general, has been sufficiently explored by others (Glaeser, 1998; Malecki, 1997; Quigley, 1998; Walcott, 2002) and need not to be addressed here. In short, most high-tech and information-rich activities require a complex urban environment with a wide range of advanced services and a large and diversified pool of talented and educated labour. As Figure 11 demonstrates, this need not necessarily mean that one locates in the heart of the metropolis, but one must at least be near, in part for the same reasons alluded to above, linked to the continuing importance of face-to-face meetings. New information technologies have not altered this reality (Gaspar and Glaeser, 1998).
None of this is good news for small and medium-sized cities in more distant locations. In short, industrial deconcentration, although a reality in Canada as elsewhere, is not reaching large parts of the nation, or at best, will arrive there only very slowly. Many parts of Canada are simply too far and too sparsely populated. Geography remains a powerful obstacle. Canada’s periphery is truly “peripheral”. The peripheral regions of Canada are, in sum, very different from what one might call a “peripheral” region in most of Western Europe (except Scandinavia) and much of the United States. In the majority of Western European nations, including France, Germany, and Italy, the movement of industrial deconcentration will eventually reach most regions in the natural course of time. The industrial success (or revival) of European regions, such as Northern France or Central Italy, should come as no surprise given their proximity to markets and to large urban centres. However, Canada’s peripheral regions face a very different reality.
0,00 0,20 0,40 0,60 0,80 1,00 1,20 1,40 1,60 1,80 Lo cati o n Qu ot ie n t
Metro1million+ Aggloms 100k Aggloms 25k Rural
Urban size class
Figure 11- Relative concentration of employment in high tech manufacturing by urban size class and location, 1996
Central Peripheral
Note: k = 1000
The importance of being close ― 2: Tourism
The advantage of being close is not limited to manufacturing. Tourist-generated activities are equally attracted to locations within easy reach of a large metropolis. “Close” communities are the primary beneficiaries of the rise of the leisure society. In Quebec, towns such Magog in the Eastern Townships or Sainte-Agathe in the Laurentians, both within about an hour’s drive from Montreal, spring to mind. Nor is it an accident, that Banff and Whistler are located within easy reach, respectively, of Calgary and Vancouver. Tourism and leisure activities, since they entail the transport of people, are sensitive to distance. This is especially true for weekend or one-day tourism, including the ownership or rental of secondary residences (cottages). Most large cities are surrounded by tourist sheds; that is, a ring of recreational destinations within easy reach, where residents of the city go for weekend outings or have secondary residences. People in Boston go to Cape Cod. New Yorkers go to the Catskills, just as Torontonians have cottages on Georgian Bay and Montrealers in the Laurentians. It is thus not surprising that “centrally” located communities often have a flourishing tourist sector. However, these are not necessarily the same “central” communities that are the chief beneficiaries of industrial deconcentration. Tourist-related activities will, by definition, be located in sites that have certain natural attributes (water, mountains, etc.). A tourist
resort such as Mont-Tremblant, north of Montreal, is a good example. Such tourist complexes serve both local (day or weekend) markets and long distance markets.
By contrast, for most Canadian “peripheral” communities, building an economic base founded on tourism is not a foregone conclusion, given the intemperate climate and their distance from major urban markets. Unless the area possesses a unique natural advantage (and even then), tourism will generally be highly seasonal, limited to a few months, generally not enough to build a significant (permanent) employment base. In the case of coastal communities, seasonality is accentuated by the fact that the fishing and tourist seasons generally overlap. The continuing economic problems of the Gaspésie in Quebec, a region with chronic unemployment, demonstrate the difficulty of building a strong year-round tourist base in a region with short summers, situated far from major markets, despite the natural attributes of the region (which houses Percé with its famous rock and Forillon National Park). Travel cost remains a major obstacle. This is especially true for island destinations such as Western Newfoundland (which houses Gros Morne National Park), where tourism is in part dependent on the cost of air travel. This is not to say that tourist activities cannot develop in the peripheral locations. What it does mean is that tourist-related employment will, in most cases, not involve large numbers and will remain highly seasonal.
The importance of being close ― 3: Nature, agriculture, and connected professionals
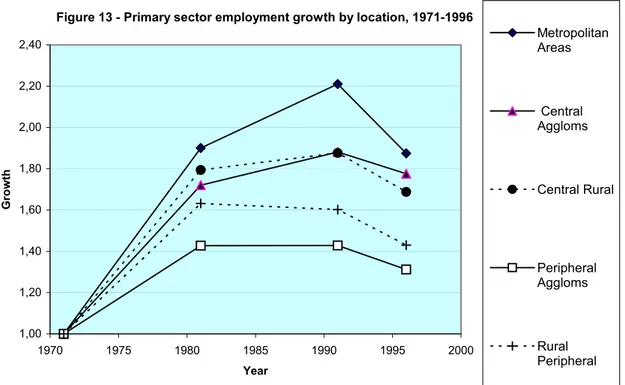
The importance of proximity (to a large urban centre) also extends to other sectors. The general trend is for employment to increasingly concentrate in rural areas and small and medium sized cities within easy reach of a large metropolis. The trend illustrated on Figure 9 is the result of the interplay of numerous factors. Employment within the primary sector, which includes agriculture, grew more rapidly in small towns and in rural areas in close proximity to urban markets than in more distant locations (see Figure 13 in the following section).
Why should even primary employment be shifting towards metropolitan locations? Technological progress is in large part to blame. As productivity in farming and related activities increases, the least productive and least fertile lands become uncompetitive, and will in many cases be abandoned. Improvements in transportation, refrigeration and food preservation reinforce this trend, to which can be added the effects of scale economies in wholesaling, marketing, and food distribution. In most of Eastern and Central Canada, the most fertile lands are close to large urban centres, specifically Southern Ontario and South-eastern Quebec. As in the case of weekend tourism, most large urban centres are surrounded by milk sheds (for dairy products) and sheds for horticulture, fresh produce, and other cash crops. In the case of Quebec, farmers in the Lower Saint.Lawrence are in direct competition with farmers in the
Montreal Plain (centred on Saint-Hyacinthe), where the soil is more fertile and the growing season longer, and with easier access to urban markets, wholesalers, distributors, and food processors. The historical trend has been for abattoirs and industrial bakeries to concentrate in and around large urban centres because of scale economies and improved transportation.
Proximity to large urban centres also facilitates the attraction of future residents in search of a more rural living environment. In recent years, there have been signs of a new taste for “rural” living among certain classes of young professionals. This residential mobility is in part made possible by new information technologies (telecommuting) and by the rise of professions that do not require a daily presence in the workplace. However, such professionals do, in general, need to visit their workplace from time to time or, in the case of self-employed workers, to meet with clients or fellow professionals. They will thus seek out “rural” residential communities that still permit them to have easy access to a major urban centre. Such rural residential communities will often be the same (or near) the weekend tourist destinations alluded to above; the professionals in question are generally important consumers of leisure activities (hiking, swimming, skiing, bicycling, etc.). The chief beneficiaries of the taste for “rural” living are, again, the amenity-rich communities within easy reach of major urban markets. The impressive population growth in recent years of communities to the north of Montreal (in the Laurentians) is in large part explained by this trend. Stated differently, the communities near large metropolitan centres are gradually becoming “metropolitanised”, even though they may be formally classified as rural or small town.
In sum, small towns and rural areas within close proximity of a major urban centre are evolving in a very different context from other small towns and rural areas in Canada. It is perhaps little exaggeration to speak of two separate worlds, two solitudes: those that are close and those that are not. If current trends continue, Canada’s “rural” and small town populations will be increasingly made up of communities located close to large urban centres, largely integrated into the economies of large urban centres. However, the majority of Canada’s rural and small town population still lives outside this metropolitan-dominated universe. To understand the challenges facing “peripheral” Canada, we shall now rapidly consider certain recent transformations, which in all likelihood will accelerate the trend towards metropolitanisation.
T
HE PROBLEMS OF BEING FAR AND THE COMING ACCELERATION OF METROPOLITANISATIONTwo major transformations are underway that mark a break with the past, both with a profound effect on the development of peripheral regions. First, after decades (even centuries) of settlement and development, the limits of natural resource
exploitation have, in most sectors, finally be been reached, and have already been passed in some cases. Second, the effects of the demographic transition are starting to be felt; that is, the impact on population growth of the decline in birth rates that began in the early 1960’s. As we shall see, these new circumstances, when added to the general tend towards continued urban concentration, will probably serve to accelerate the relative decline of peripheral communities.
The employment effects of constraints on natural resource exploitation
Most of Canada’s peripheral regions were first settled by Europeans to exploit natural resources: forests (wood), rivers (hydro power), oceans (fish), the soil (farming), the subsoil (minerals), etc. Indeed, this was largely true of all of Canada until the rise of the industrial revolution. The economies of most peripheral regions in Canada continue to be highly dependant on resource-based industries, whether in primary exploitation (fishing, logging, farming, etc.), in manufacturing (processing) or in service sector activities (distribution, transportation, etc.). For any given size class, peripheral communities are always more dependant on the primary sector than comparable central locations (Figure 12). 0 0,5 1 1,5 2 2,5 3 3,5 L o ca ti o n Q u o ti en t 1Million + 500k-1Million 100-500k 50-100k 25-50k 10-25k Rural
Urban size class
Figure 12 - Relative concentration of employment in the primary sector by urban size class and location, 1996
Central Peripheral
Until recently, fairly stable employment levels were maintained, even in the face of increasing productivity, by exploiting ever more resources: by catching more fish; by harvesting more trees; etc. Increases in productivity per worker have been exerting downward pressures on employment since the beginning of industrialisation. Fewer workers are required today to harvest the same quantity of trees, to catch the same quantity of fish, or to mine the same quantity of iron ore. This is a continuing trend. The resource-based manufacturing sector follows the same model. Firms are often highly capital intensive, specifically in pulp and paper production and in metal (or aluminium) refining and processing, requiring ever fewer employees as a result of new investments in new machinery, plants, and equipment. Alcan’s new plant in Alma, for example, produces the same quantity of refined aluminium with five times less employees, compared to older plants nearby.
What is new is that the quantity of local resources that can be extracted or harvested, and subsequently processed, can in most cases no longer be expanded. In some cases, the resource-base has even declined or disappeared, the most dramatic examples being the collapse of the ground fish (mainly cod) in the early 1990’s and the reduction in available trees (for cutting), most notably in the valley communities of the Lower Saint-Lawrence. Whether resource limits or reductions are the result of natural constraints or of mismanagement is not the issue (usually, it is a combination of both). What is crucial for the future is that the consequences for employment creation in resource-based industries are entirely predictable: 1) continuing increases in productivity mean ever fewer jobs per quantity extracted and processed; 2) if quantity is held constant, employment will necessarily fall. Obviously, the precise results of this equation will vary from resource to resource and between regions. In some cases, resource-based employment may continue to increase. However, the general trend towards the decline of resource-based employment appears irreversible.
Figure 13 shows the evolution of primary sector employment7 by region and
city-size from 1971 to 1996. Primary sector employment growth has halted and even declined since the late 1980’s and early 1990’s. This marks a break with the past. Employment grew (or at least did not decline) in all city size categories before 1991, with the exception of rural peripheral communities where the decline began earlier, a reflection in part of the continuing decline of farming populations (especially in the Prairies) and of the collapse of the oil boom in Alberta and the mining boom on Quebec’s North Shore. Employment in the primary sector continued to fall during the recent period of expansion (1993-2000) despite impressive employment growth in the Canadian economy as a whole (Statistics Canada, 2002).
7 Primary sector employment includes agriculture (farming), fishing, forestry, mining, and oil and gas
Figure 13 - Primary sector employment growth by location, 1971-1996 1,00 1,20 1,40 1,60 1,80 2,00 2,20 2,40 1970 1975 1980 1985 1990 1995 2000 Year Gr o w th Metropolitan Areas Central Aggloms Central Rural Peripheral Aggloms Rural Peripheral
The decline in primary sector employment since the late 1980’s is largely the result of the combined effect of productivity increases and resource quantity constraints alluded to above. Other factors also enter into play. International competition has had an impact, especially in the mining sector, as less costly deposits are discovered in other nations8. New technologies, specifically the introduction of substitutes, have equally had
an impact. In farming, declines in employment are also a reflection of the gradual abandonment of less fertile and less well-located lands, as local market-oriented agriculture (as well as food processing and distribution) increasingly concentrate near large urban centres, as noted earlier. As Figure 13 illustrates, peripheral communities face a double challenge: 1) the general decline in primary sector employment; 2) the shift in primary sector employment towards central locations.
The territorial impact of the demographic transition
The second major change concerns the end, in most cases, of population growth. It is important to note that peripheral regions are not alone in feeling the impact of the demographic transition. All Canadian regions will see their populations age, and almost all Canadian regions will eventually enter a period of population decline. In this respect, Canada is no different from other developed nations. What makes Canada’s
peripheral regions different is that they will feel the effects earlier than most. The main culprit is out-migration.
The demographic evolution of most peripheral regions is not difficult to understand. Until fairly recently, natural population growth due to a continuing surplus of births over deaths (the tail end of the baby boom) allowed populations to grow or at least to remain stable in most peripheral communities, despite continued net out-migration. In essence, natural population growth compensated for the effects of net out-migration. Out-migration is not a new phenomenon. Most peripheral regions, especially rural communities, have been living with out-migration for decades. But, this did not necessarily translate into significant population losses. That is about to change, and has already begun to change in many cases. Natural population growth will no longer compensate for net out-migration. In the future, net out-migration will necessarily mean population losses.
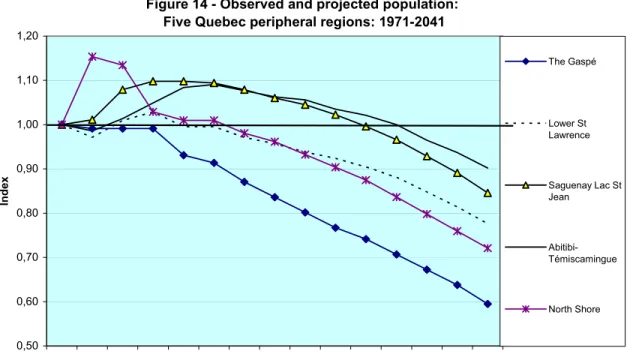
The consequences of this transformation are evident on Figure 14 which shows population forecasts for the peripheral regions of Quebec 9. Their combined population
has already begun to fall, going from 870,000 in 1996 to a predicted 660,000 in 2041, meaning that their share of the Province’s population is predicted to fall from 12% to about 8,8%. We see that the Gaspésie, arguably Quebec’s most “peripheral” region is the first to have seen its population decline, and is the region whose population is predicted to decline the most sharply. In sum, the most peripheral regions are the first to be effected; but in time, like a line of falling dominos, all regions will eventually feel the combined effects of falling birth rates, aging, and continued out-migration. Figure 14 also illustrates the boom and bust history of Quebec’s North Shore, with a sharp rise in population during the 1970’s and an equally sharp decline subsequently.
NAFTA, globalization, and the return of geography
Trade flows are increasingly determined by comparative advantage, including geography, and less and less so by regulations, subsidies, and national borders (tariffs and other trade barriers). In this respect, Canada is following the general model. Regulations and subsidy schemes aimed at developing the national market and east-west trade have been dismantled. Rail and air transport services have been privatized and subsidies reduced. The Federal government is increasingly transferring the management of harbours and airports to the private sector or to local consortia. The signing of the North American Free Trade Agreement (NAFTA) has meant an ever lessening of trade barriers with the United States. Other agreements in the framework of
9 Source: ISQ (2002). Our projections are limited to Quebec regions because no similar source exists for
Figure 14 - Observed and projected population: Five Quebec peripheral regions: 1971-2041
0,50 0,60 0,70 0,80 0,90 1,00 1,10 1,20 1971 1976 1981 1986 1991 1996 2001 2006 2011 2016 2021 2026 2031 2036 2041 Year Index The Gaspé Lower St Lawrence Saguenay Lac St Jean Abitibi-Témiscamingue North Shore
Note: Index = Population in year x / Population in 1971
the World Trade Organization (WTO) go in the same direction. The results are not difficult to deduce: an ever greater share of Canada’s production is exported to U.S. markets. Most Canadian Provinces, most notably Ontario and Quebec, now export more to U. S. markets than to other Canadian Provinces. This is also a break with the past.
North-south flows are replacing what some would say were artificially created east-west flows. These new trade patterns are changing the relative location advantage of regions in Canada. “Natural” trading patterns are re-emerging. It is geography that is increasingly determining the direction of trade, rather than public policy. This alters what it means to be peripheral. Being “peripheral” is increasingly perceived in terms of relative distance from U.S. markets rather than from Canadian markets. For most firms that seek to expand beyond their home regions, the ultimate (or even primary) objective is increasingly the U.S. market. In this new game, not all Canadian regions are equally well positioned. A rapid glance at a map of North America reveals that what we have defined as “central” regions, specifically Southern Ontario, south-eastern Quebec, and B.C.’s lower mainland (centred, respectively, on Toronto, Montreal, and Vancouver) have a clear cost advantage for serving U. S. core markets. This is an additional factor driving the concentration of economic activity in and around the largest metropolitan areas. In addition, international trade is generally an important engine of urban growth since most ancillary services surrounding trade (insurance, distribution, banking, marketing, etc.) are located in large urban centres.
This will probably accentuate the South-North divide in most provinces outside of Atlantic Canada. Regions located north of Montreal (or north of Quebec City) in Quebec or north, say of Orillia, in Ontario are clearly at a disadvantage compared to others in the same province. Trade is always a matter of comparative advantage (or location).
It can be argued that NAFTA has accentuated the peripheral character of certain regions10. None of Quebec’s peripheral regions, for example, outside the Montreal-Quebec City corridor, is well located for trade with the United States; that is, not relative to the others. Even if the Beauce region11, located to the north of Maine, is obviously
peripheral seen from New York or Boston, the Gaspésie and North Shore regions are even more so. To serve U.S. markets, why locate a plant in the Gaspésie if it is possible to locate in the Beauce, closer to U.S. markets, as well as being close to a large urban centre? By the same token, because of the impact of volume on transport costs, increased trade will favour communities located on major transport axes with access to U.S. markets.
C
ONCLUSIONOur conclusion is summarized in six points, starting with a synthesis of observed trends, followed by a brief discussion of possible policy and political implications:
1. In Canada, the major urban centres have continued to grow at a faster pace than the rest of the nation. An increasing share of Canadians lives in major metropolitan areas. In this respect, Canada is not much different from other industrialised nations.
2. The regions surrounding major urban centres (a radius of approximately 100 to 150 km) are also growing more rapidly, the chief beneficiaries of industrial deconcentration, weekend leisure activities, and the residential mobility of connected professionals. The dividing line between “urban” space and “rural” space is becoming increasingly blurred within this broad metropolitan-dominated universe. Here again, Canada is not much different from other industrialised nations.
3. Where the Canadian experience starts to differ is in the vast expanse of territory that lies beyond this metropolitan-dominated universe, and which still holds a
10 A comparison with Mexico is not totally out of line. In a recent World Bank sponsored survey of
880 Mexican manufacturing firms, three factors systematically stood out as determinants of plant location: 1) proximity to markets, chiefly U.S. markets; 2) transport costs; 3) computer literacy and knowledge of English of the local labour force. Southern states are becoming increasingly peripheral as Mexico’s economic centre of gravity shifts north, closer to the U.S. The answer for language is noteworthy. If transposed to Canada, this would put Quebec’s peripheral regions at a relative disadvantage, compared to other trading regions with the U.S. (World Bank, 2001).
significant (although declining) share of the Canadian population. With some exceptions (notably, regions with middle-sized urban areas such as Halifax and Saskatoon12) the economy of much of non-metropolitan Canada remains tied to
traditional resource industries. Because of distance and sparse settlement patterns, most of non-metropolitan Canada will remain unsuitable for manufacturing beyond the primary stages of resource transformation. In this respect, Canada is probably not unlike Australia, Russia, and perhaps parts of Scandinavia.
4. Where the evolution becomes more alarming is in the (foreseeable) impact of recent transformations, which signal a break with past and which will in turn accelerate metropolitanisation and increase the vulnerability of “peripheral” regions in Canada. The combined impact of continued (labour) productivity growth plus new constraints on resource exploitation necessarily translate into lower employment, while the impact of the demographic transition combined with continuing net emigration necessarily means population decline. The political and policy impacts of these transformations will most probably be felt at two levels: 5. The growing complexity and blurred nature of metropolitan areas, often with no
clear boundaries, means that the issue of metropolitan governance will remain on the table. Finding the appropriate administrative structures to deal with the myriad interrelations that characterize metropolitan-dominated regions (or city regions, as some prefer to call them) will remain a challenge. The recent municipal reforms in Ontario and Quebec, leading notably to the creation of two mega-cities, are attempts (though still very incomplete) to find answers. However, on this issue, Canada is not very different from other industrialised nations in search of appropriate models of metropolitan governance.
6. Where Canada differs is in the deepening divergence between the evolution of metropolitan and non-metropolitan (or “peripheral”) regions. This will mean two very different political agendas. The metropolitan agenda will focus on matters such as immigration, housing, public security, public transport, and metropolitan governance (previous point), while the non metropolitan agenda will stress unemployment insurance, regional economic development incentives, school and hospital closures, and in some cases simply “survival”. The conflict of agendas will often play out within provinces, between the provincial metropolis and other more distant regions.
R
EFERENCESCoffey, W.J. and M. Polèse (1988). “Locational shifts in Canadian employment, 1971-1981, decentralisation versus decongestion,” The Canadian Geographer 32 (3): 248-255.
Coffey, W.J. and R. Shearmur (1996). Employment Growth and Change in the Canadian Urban System, 1971-1994. Working Paper No. 2. Canadian Policy Research Network, Ottawa.
Gaspar, J. and E. Glaeser (1998). “Information technology and the future of cities,” Journal of Urban Economics 43 (1): 136-156.
Glaeser, E. L. (1998). “Are Cities Dying?” Journal of Economic Perspectives 12 (2): 139-160.
Graham, D. and N. Spence (1997). “Competition for metropolitan resources: The ‘crowding out’ of London’s manufacturing industry,” Environment and Planning A 29 (3): 459-484.
Henderson, J. V. (1997). “Medium sized cities,” Regional Science and Urban Economics 27: 583-612.
Ingram, G. K. (1998). “Patterns of metropolitan development: What have we learned?” Urban Studies 35 (7): 1019-1035.
ISQ (2002). Perspectives démographiques des régions administratives et des municipalités régionales de comté 1996-2041. Mise à jour du scénario A de référence. Institut de la Statistique du Québec. Available on-line at
http://www.stat.gouv.qc.ca/publications/demograp/pers_demo.htm
Malecki, E. (1997). Technology and Economic Development: The Dynamics of Local, Regional, and National Competitiveness. London: Addison Wesley/Longman. McNiven, C., H. Puderer, and D. James (2000). Census Metropolitan Areas and Census
Agglomeration Influenced Zones (MIZ): A Description of the Methodology. Geography Working Paper Series, No. 2000-02. Geography Division, Statistics Canada, Ottawa.
Polèse, M. and E. Champagne (1999). “Location matters: Comparing the distribution of economic activity in the Mexican and Canadian urban systems”, International Regional Science Review 22 (1): 102-132.
Polèse, M. and R. Shearmur (2002). The Periphery in the Knowledge-based Economy: The Spatial Dynamics of the Canadian Economy and the Future of Non-Metropolitan Regions in Quebec and the Atlantic Provinces, INRS-UCS, Montreal. Available on-line at http://www.inrs-ucs.uquebec.ca/default.asp?p=res
Quigely, J. M. (1998). “Urban diversity and economic growth,” Journal of Economic Perspectives 12 (2): 127-138.
Statistics Canada (2002). Labour Force Historical Review. Catalogue 71F0004XCB (CD-ROM). Statistics Canada, Ottawa.
TCE (2001). The Canadian Encyclopaedia: World Edition / L’Encyclopédie canadienne (CD-ROM). Toronto: McClelland & Stewart.
Walcott, S. (2002). “Analyzing an innovative environment: San Diego as a bioscience beachhead,” Economic Development Quarterly 16 (2): 99-114.
World Bank (2001). Economía Urbana: ¿Cuál es la clave de la competitividad? Study prepared by the Instituto Panamericano de Alta Dirección de Empresa (IPADE) for the Mexico Country Managements Unit. Washington, D.C: Word Bank.
World Bank (2002). World Bank Development Indicators 2001 (CD-ROM). Washington, D.C: World Bank.