A Survey of Urban Agriculture Organizations and Businesses in the US and Canada: Preliminary Results
19
0
0
Texte intégral
(2) A Survey of Urban Agriculture Organizations and Businesses in the US and Canada Preliminary Results. Nathan McClintock & Mike Simpson Toulan School of Urban Studies and Planning Portland State University July 2014.
(3) Suggested citation: McClintock, N., and Simpson, M. (2014) A Survey of Urban Agriculture Organizations and Businesses in the US and Canada: Preliminary Results. Portland State University, Toulan School of Urban Studies and Planning, Portland, OR. Available at www.urbanfood.org.. A Survey of Urban Agriculture Organizations and Businesses in the US and Canada: Preliminary Results by N. McClintock and M. Simpson (including all text, figures, and images therein) is licensed under a Creative Commons Attribution-NonCommercial-NoDerivatives 4.0 International License. Based on a work at www.urbanfood.org. For more information, visit http://creativecommons.org/licenses/by-nc-nd/4.0/.. Photos by N. McClintock. Cover (clockwise from top-left): Santropol Roulant, Montréal, QC; People’s Grocery, Oakland, CA; Sole Food Street Farms, Vancouver, BC; Blue House Greenhouse Farm, Portland, OR. Final page (p.16): City Farm, Chicago, IL.. Acknowledgements. We are extremely grateful to all of the respondents for taking the time to complete the survey. We also wish to thank Alexandrine Boudreault-Fournier for her comments and proofreading of the French survey; UQAM’s Eric Duchemin and AU/Lab for distribution of the survey in Québec; Taren Evans for her assistance in identifying potential survey respondents; and Anthony Levenda for help in coding open-ended responses. This research was funded in part through a PSU Faculty Enhancement Grant.. Nathan McClintock is Assistant Professor of Urban Studies and Planning at Portland State University, where he researches and teaches on urban agriculture, food systems, and just sustainability. Mike Simpson recently completed his Master of Urban Studies and Planning degree at Portland State University and is beginning doctoral studies in political theory at the University of Victoria. For more information about this and other projects, visit www.urbanfood.org. We welcome your questions and comments! Please contact us at urbanagsurvey@pdx.edu or at the following postal address: Nathan McClintock, PhD Toulan School of Urban Studies and Planning Portland State University P.O. Box 751 – USP Portland, OR 97217 USA.
(4) Executive Summary This report summarizes the results of an online survey, conducted during February and March 2013, of 251 groups involved with urban agriculture (UA) projects in approximately 84 cities in the US and Canada. This is only a preliminary report. As such, we present descriptive statistics rather than a interpretive analysis of the survey responses. Furthermore, it is important to recognize that these results are not necessarily representative of all urban agriculture businesses and organizations across North America. Nevertheless, these results point to certain trends and patterns that offer rich opportunities for further inquiry. Our preliminary results reveal that the UA landscape is highly diverse. From beekeeping on balconies to vegetable production on multi-acre farms, UA incorporates a broad range of practices on a diversity of types of urban spaces across North America. Survey results also reveal the wide diversity of groups practicing UA, from businesses to non-profits to public institutions to informal collectives. These groups vary in size; some are entirely focused on UA work, while for others, UA is a secondary activity. We highlight some of the differences in how these groups practice UA, and how these practices vary between cities. Groups face many similar challenges in terms of funding, labor, and access to space, but certain barriers and needs are greater in some cities than in others. Funding for UA projects – if there is any at all – can come from many different sources and, in some cases, the source of funding impacts the type of UA practiced. Finally, the motivations of groups practicing UA are diverse. While groups frame their engagement in UA a variety of ways, however, interest in community building, education, food quality, and sustainability drives most UA practice among our respondents.. 1. Survey Distribution & Response The survey was directly distributed to 619 businesses and organizations from over 70 cities in Canada and the United States, including most major Canadian metropolitan areas and a geographically representative sample of cities from the US. Of this group, 548 (from 50 cities) were identified either via internet searches or from direct personal and professional contacts, while the remaining groups (from 25 cities) were identified by survey respondents themselves. Of the total number of groups that we contacted directly, 125 from 46 different cities responded, a response rate of 20%. The survey was also disseminated via several national list-serves in both Canada and the US1 and to over 100 other non-affiliated individual contacts involved in UA who we asked to forward the survey on to their own contacts involved with UA organizations or businesses. In total, we received 300 responses from businesses and organizations in 108 different municipalities (see Figure 1.1). Nearly all responses were received between February and April 2013. We omitted 49 responses from the final dataset. We kept only those responses from businesses and organizations that actively practice UA in Canada or the United States. We also removed organizations that cultivate solely in peri-urban areas were also removed. Finally, in cases where we received more than one response from a business or organization, we included only one response in our dataset. In the end, we retained a total of 251 responses from 84 cities; 120 of these were organizations that we contacted directly, while 131 were contacted via our “snowball” dissemination.. National list serves included COMFOOD, Food Planning, CFSC Urban Agriculture, as well as those belonging to the AAG Geographies of Food and Agriculture Specialty Group, the Canadian Association of Geographers, and Le collectif de recherche en l’aménagement paysager et en agriculture urbaine durable (CRAPAUD). 1. 1.
(5) Of the 251 responses in our final dataset, 58 were completed by businesses and 193 were from other types of organizations. Portland, OR, the San Francisco Bay Area, and Montréal, QC were the three metropolitan areas with the greatest number of responses (Figure 1.2). There were more responses from Portland than from other cities, likely due to the origin of the study. All survey participants were given a choice of taking the survey in English or in French, with the option to request the survey in Spanish. Twenty-two of the responses from the final dataset were received in French and 229 were in English. No requests for a Spanish survey were received.. Figure 1.1: Geographic distribution of surveyed urban agriculture organizations and businesses. Our final dataset consisted of survey responses from 251 businesses and organizations across 84 cities in the United States and Canada. Six hundred and eighteen businesses and organizations were contacted directly, of which 125 responded - a 20% response rate. Other businesses and organizations that responded were contacted via “snowball” dissemination. Note that some suburbs/conurbations have been aggregated. eg., Bay Area includes San Francisco, Oakland, Berkeley; Montréal includes Longueuil and Laval; Vancouver includes Burnaby and Richmond.. For the purpose of analysis, we grouped each of the responses into analysis groups based on organizational type and geography. We grouped businesses into their own analysis group; given the comparatively small number of businesses that responded, we did not disaggregate businesses by metropolitan area. However, all other organizations were grouped by their geographical locations – Portland, the Bay Area, and Montréal, as well as Other US and Other Canada. For the purposes of this report, when we refer to organizations this includes all non-business organizations such as non-profits, schools, informal community-based groups, and government agencies. Figure 1.3 shows the distribution of respondents by organizational type, and Figure 1.4 shows the distribution of respondents by analysis groups where all businesses were disaggregated and then all remaining organizations were categorized based on their geography. 2.
(6) Portland. 37. Bay Area. 26. Montréal. 24. Toronto. 14. Vancouver. 13. Seattle. 11. Chicago. 10. NYC. 8. Los Angeles. 6. Minneapolis/St. Paul. 6. Figure 1.2: Number of responses from the ten most represented cities (count). Non-Profit or Charity. 98. Private Business. 58. School, University, or Student Group. 27. Community Based Organizations. 29. Government. 9. Public Private Partnership. Other. 6. 3. Figure 1.3: Respondents by organizational type. 87. 58. 36. 24. 27. Bay Area. Portland. 19. Montréal. Other US. Other Canada. Businesses. Figure 1.4: Respondents by analysis group. Note: Bay Area, Portland, Montréal, Other US, and Other Canada analysis groups include only non-business respondents from these regions. All respondents from businesses are included in the Businesses analysis group. In parts of this report, we refer to Organizations to refer to all responses from non-business organizations.. 3.
(7) 2. Activities & Motivations We asked respondents if their group is involved in any of 16 different UA activities, and which of these activities they consider to be a primary focus. The results illustrate the wide range of agricultural activities practiced in urban landscapes across North America. Nearly 90% of organizations indicated that they focus on more than just one of the activities that we asked about; indeed, on average each group focused on almost six different activities. Figure 2.1 shows each of the types of activities that we asked about listed from most to least commonly practiced. Survey results further demonstrate a marked difference between the types of UA activities practiced by businesses as compared to other organizations. For instance, Figure 2.1 shows that more than half of all surveyed businesses indicated that market gardening was one of their primary focuses, compared to only one in five organizations. In contrast, educational programs, operating collective gardens, and managing demonstration gardens were commonly noted as primary focuses of non-businesses, but were each noticeably less common focuses among businesses. Collectively operated gardens appear to be much more common in Montréal, where 57% of organizations that responded indicated that this was a primary focus. Conversely, only 5% of Montréal organizations operate allotment gardens as a primary focus, in contrast with over a quarter of the organizations from all cities.. Education. Collective Gardens. 27%. 9%. Policy / Advocacy. 9%. Market Garden. 23%. 21%. 21%. 24%. Edible Landscaping. Gleaning. Community Orchards. Beekeeping. 3%. Animal Husbandry. Aquaponics. 27%. 16%. Allotment Gardens. Nursury. 32%. 16%. Compost. Greenhouse. 35%. 10%. Demonstration Garden. Therapeutic. 54%. 14%. 57%. 15%. 17%. 11%. 9%. 9%. 7%. 7%. 7%. 10%. 5%. 0%. 3%. 1%. Organizations. 9%. Businesses. 5%. Figure 2.1: Primary urban agriculture activities of surveyed businesses and organizations. Respondents were also asked to indicate their primary motivations for engaging in UA from a list of 20 choices. Results suggest that the motivations of businesses and organizations are as wide-ranging as the types of agriculture they practice. Likewise, through written responses to an open-ended question about motivations, many respondents underscored the multiple public benefits that UA provides. Overall, the most common motivations for engaging in UA practices are community building, concerns about food quality, environmental concerns, and interests in sustainability. While each of these motivations scored high among both businesses and 4.
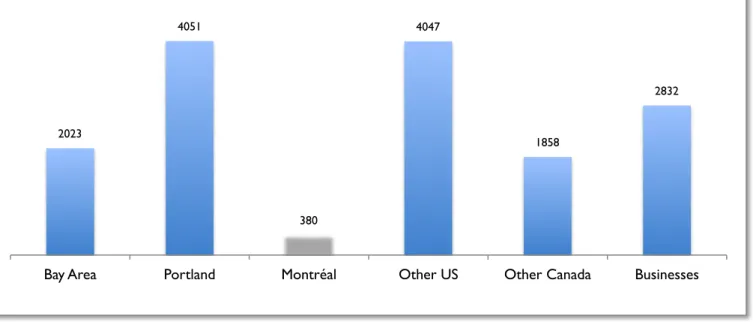
(8) organizations, community building was more commonly cited as a motivation by organizations, whereas sustainability and environmental concerns were more commonly cited as motivations by businesses (Figure 2.2). Results underscore that most surveyed businesses are not only motivated by income/profitability, but also by progressive environmental and social concerns.. Community Building. Education. 79%. 77%. 57%. Food Quality. 88%. 69%. Sustainability. 91%. 68%. 67%. 66%. Food Security. Environmental . 52%. Public Health. Food Justice. 45%. 42%. Self-sufficiency. Social Justice. 31%. Food Sovereignty. Reclamation of the Commons. Ecological Restoration. Recreational Hobby. 17%. 19%. Alternative Economy. 88%. 57%. 50%. 50%. 41%. 38%. 41%. 30%. 26%. 26%. 28%. 25%. 25%. Job Training. 28%. 40%. 18%. 10%. 15%. Therapeutic. Income / Profitability. 8%. 10%. Other. Faith-Based. 85%. 62%. 5%. 3%. 76%. Organizations. Businesses. Figure 2.2: Primary motivations for engagement in urban agriculture. 3. Size & Location Over two-thirds of the businesses and organizations that responded indicated that they practice UA at more than one location; more than half of the respondents actually practice UA on three or more sites. Results also suggest some variation in the number of sites used by organizations in different cities. For instance, Bay Area organizations use a median of four sites, whereas the Portland median was only two. Similarly, the total area that businesses and organizations use for UA varies considerably, from less than a few square meters to several acres. The median area used by all businesses and organizations is about half an acre. This seems to vary in accordance with city and region as well, ranging from a median area of less than 5,000 square feet among Montréal organizations to a median area of about an acre among Portland organizations (Figure 3.1). Nearly threequarters of organizations from Montréal expressed that they would ‘very much’ or ‘tremendously’ benefit from access to more space, compared to only half of Portland organizations. Respondents were also asked about the amount of food their projects yielded in the past year, but because only one-third of respondents answered this question, yield results are inconclusive and highly variable. 5.
(9) 4051. 4047. 2832. 2023. 1858. 380. Bay Area. Portland. Montréal. Other US. Other Canada. Businesses. Figure 3.1: Median area (m2) devoted to urban agriculture activities (by analysis group). Respondents also indicated that their UA projects were located in a variety of different types of urban spaces (Figure 3.2). The two most commonly used spaces were yards and vacant lots, both of which were used by over half of the respondents. Only 7% of businesses and organizations indicated that they were practicing UA on an existing farm site or agricultural land. The use of public parks appears to vary between locations and types of practitioners. UA appears to be more commonly practiced in parks by organizations than it is by businesses. Further, nearly half of the organizations practicing UA in Canadian cities outside of Montréal (49%) indicated that they practice UA in public parks. In Montréal, rooftops are used by 56% of all organizations, making this the second most common type of location after yards in the city. In contrast, rooftops are only used as a location by 8% of organizations in the Bay Area, and only 4% of organizations in Portland. Balconies and walls are also used by one-third of organizations in Montréal, whereas none of the organizations that responded from the Bay Area or Portland indicated that they use such spaces for UA purposes.. 56%. 57%. Vacant Lot. 54%. Yard. Public Park. 14%. Greenhouse. Other. 59%. 26%. 20%. 33%. 19%. 7%. 13%. 12%. Rooftop. Farm Site. 7%. 7%. Inside Building. 7%. Balcony / Wall. 4%. 7%. 22%. Organizations. Businesses. Figure 3.2: Percent of respondents using particular location types for UA projects. 6.
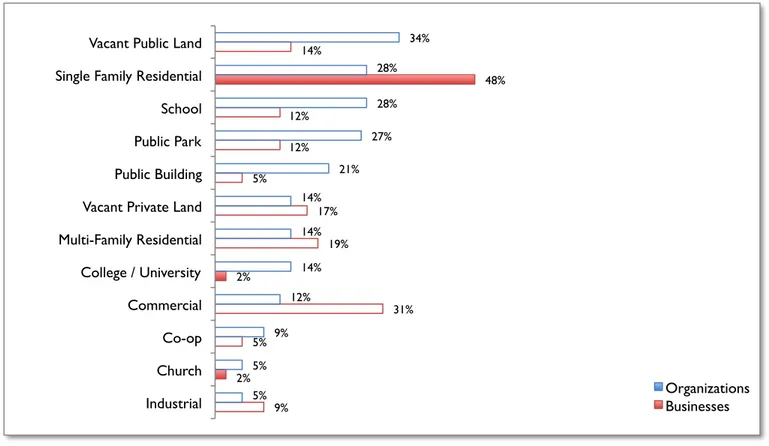
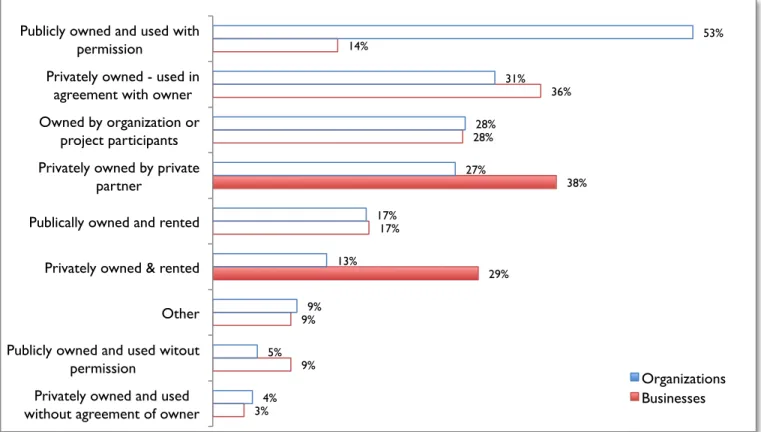
(10) In addition to asking about these specific locations, we also asked UA practitioners about the primary land use of the sites they use. Respondents most commonly indicated that they use single-family residential land for their UA practices; however, this appears more common among businesses than other organizations (Figure 3.3). Surveyed businesses are also more likely to practice UA on commercially zoned land, whereas organizations are more likely to practice UA on public land such as schools, parks, public buildings, or colleges and universities. Over one-third of organizations indicated that they are using vacant public land for UA activities. Among cities, Portland had the highest occurrence of organizations that use school land for their UA projects (42%), as compared to one-third of organizations in the Bay Area and Montréal, and roughly one quarter of all respondents. Public parks are the most common type of land used by organizations for their UA projects in the Bay Area (42%), and while public parks are used substantially more frequently there than in other US cities nearly half of the organizations from Canadian cities outside of Montréal indicated that they also use public parks. In Montréal, half of all organizations indicated that they use land associated with public buildings for UA, which was the most common land use type in that city, and substantially more common than in the Bay Area (17%) or Portland (12%).. Vacant Public Land. 34%. 14%. 28%. Single Family Residential. School. 12%. Public Park. 12%. Public Building. 14%. 12%. Industrial. 5%. 5%. 2%. 5%. 19%. 14%. 2%. Commercial. Church. 27%. 14%. 17%. Multi-Family Residential. Co-op. 28%. 21%. 5%. Vacant Private Land. College / University. 48%. 31%. 9%. 9%. Organizations. Businesses. Figure 3.3: Percent of respondents using particular land use types for urban agriculture projects. Our survey data also show that UA practitioners engage in a range of different land tenure arrangements. Only about a quarter of respondents indicated that they (or a project participant) actually own the land that they use for UA; approximately one-third use land that is privately owned by a partner organization (Figure 3.4). Businesses are more likely to rent private land for UA use than other organizations, whereas organizations were far more likely to be granted permission to use public land. A small number of businesses and organizations reported using either public or private land without having permission from the landowner. Businesses are slightly more likely to use public land without permission than were organizations.. 7.
(11) Publicly owned and used with permission. 53%. 14%. Privately owned - used in agreement with owner. 31%. Owned by organization or project participants. 28%. 28%. Privately owned by private partner. 27%. 13%. Privately owned & rented. 29%. 9%. 9%. Other. Privately owned and used without agreement of owner. 38%. 17%. 17%. Publically owned and rented. Publicly owned and used witout permission. 36%. 5%. 9%. 4%. 3%. Organizations. Businesses. Figure 3.4: Percent of respondents engaged in particular land tenure arrangements. 4. Budgets & Funding Most of the businesses and organizations that responded to our survey indicated that they allocate less than their entire budget to UA projects. This suggests that many of the businesses and organizations that practice UA are not exclusively focused on UA. The median annual budget of both businesses and organizations that responded was between $10,000 and $50,000, while the median amount allocated to UA projects was between $5,000 and $10,000 (Figure 4.1 and Figure 4.2). The range of UA budgets vary substantially. Nearly one quarter of all businesses and organizations indicated that they allocate between $0 and $1000 toward UA projects, whereas one business and one organization indicated that they invest over $1million per year on UA projects. Four other organizations indicated that they allocate between a half million and a million dollars.. 8.
(12) Organizations. Businesses. 31%. 20%. 16% 16%. 15%. 10%. 16%. 15%. 9% 10%. 10%. 10%. 8%. 6%. 6%. 2%. $0 - $1K. $1K - $5K. $5K - $10K. $10K - $50K. $50K - $100K. $100K - $500K $500K - $1 million. > $1 million. Figure 4.1: Total budget of businesses and organizations engaged in urban agriculture. Organizations. Businesses. 24%. 24%. 24%. 22%. 17%. 19%. 17%. 10%. 8%. 13%. 12%. 4%. $0 - $1K. $1K - $5K. $5K - $10K. $10K - $50K. $50K - $100K. 3%. 1%. 0%. $100K - $500K $500K - $1 million. 2%. > $1 million. Figure 4.2: Size of budget allocated to urban agriculture projects. 78%. Organizations. Businesses. 27%. 23%. 20%. 1%. Government Funding . 3%. Private Foundations . 9%. Individual Donations . 12%. 5%. 2%. Corporate . Sales. 13%. 7%. Other. Figure 4.3: Revenue sources as average percent of budget. 9.
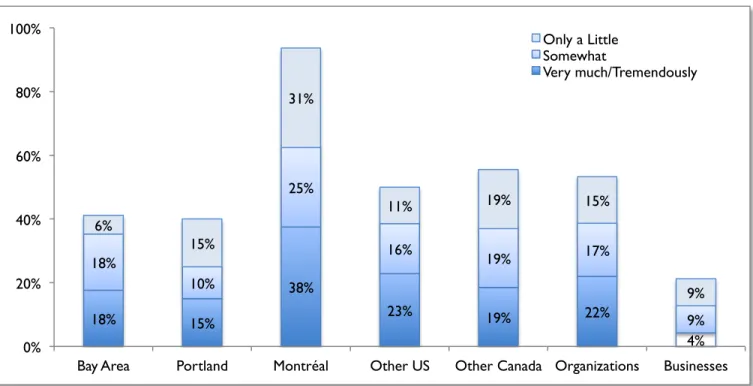
(13) Survey results also reveal that the sources of revenue differ substantially between the businesses and organizations that practice UA. On average, businesses practicing UA generate over three-quarters of their revenues from sales, whereas sales comprise only an average of 12% of revenues for the organizations (Figure 4.3). In contrast, organizations generate an average of nearly three-quarters of revenues from a combination of government funding, individual donations, and private donations. On average, Montréal organizations derive more than half of their funding from government sources, whereas organizations in the Bay Area and Portland derive on average only 20% and 16% of revenues from government, respectively. When asked how much their UA projects currently rely on government funding, nearly two-thirds of respondents from Montréal organizations answered ‘somewhat’ to ‘tremendously’, compared to about onethird of Bay Area respondents and one quarter of Portland respondents (Figure 4.4). Much of this government funding for Montréal organizations appears to be coming from the Québec provincial government. Over 80% of Montréal area respondents reported having received provincial government grants, whereas just over half reported receiving municipal grants, and one quarter reported receiving federal grants. Still, over 80% of respondents from Montréal organizations also indicated that they would benefit ‘very much’ or ‘tremendously’ from more government funding, compared to just 43% of Bay Area and Portland organizations. Montréal organizations also indicated that they are considerably less reliant on private funding than Bay Area and Portland organizations (Figure 4.5). Nearly two-thirds of all organizations indicated that they would benefit ‘very much’ or ‘tremendously’ from more private funding, compared to less than half of businesses. When asked to what extent they have changed or modified the focus of their projects in response to particular funding opportunities, 10% of organizations indicated they have modified their focus ‘very much’ or ‘tremendously’. Some regional variation is visible in Figure 4.6. Businesses were also notably less likely to change or modify their focus in response to funding.. 100%. Only a Little. Somewhat. Very much/Tremendously. 80%. 31%. 60%. 25%. 40%. 11%. 19%. 15%. 6%. 15%. 16%. 18%. 20%. 10%. 18%. 15%. Bay Area. Portland. 19%. 17%. 38%. 9%. 23%. 19%. 22%. 0%. Montréal. Other US. Other Canada Organizations. 9%. 4%. Businesses. Figure 4.4: Reliance on government funding. We asked, “How much do your urban agriculture projects currently rely on government funding?” Note that we have aggregated responses for ‘very much’ and ‘tremendously’ and that the remaining responses in each column were ‘not at all’.. 10.
(14) 100%. Only a Little. Somewhat. Very much/Tremendously. 80%. 14%. 20%. 60%. 20%. 40%. 9%. 20%. 27%. 32%. 19%. 26%. 38%. 42%. 40%. 27%. 26%. 21%. 21%. 34%. 11%. 22%. 39%. 13%. 0%. Bay Area. Portland. Montréal. Other US. Other Canada Organizations. Businesses. Figure 4.5: Reliance on private funding. We asked, “How much do your urban agriculture projects currently rely on private funding?” Note that we have aggregated responses for ‘very much’ and ‘tremendously’ and that the remaining responses in each column were ‘not at all’.. 100%. Only a Little . Somewhat. Very Much / Tremendously. 80%. 60%. 19%. 40%. 29%. 0%. 14%. 10%. Bay Area. 30%. 31%. 23%. 22%. 11%. 10%. 26%. 31%. 20%. 37%. 26%. 0%. Portland. 21%. 13%. 17%. Montréal. Other US. 20%. 7%. Other Canada Organizations. 7%. Businesses. Figure 4.6: Modification of focus due to funding. We asked, “To what extent have you changed or modified the focus of your project in response to particular funding opportunities?” Note that we have aggregated responses for ‘very much’ and ‘tremendously’ and that the remaining responses in each column were ‘not at all’.. 11.
(15) Survey results also suggest that many UA projects benefit from informal economic relations and non-monetary forms of support. In total, about one-quarter of organizations reported benefiting ‘very much’ or ‘tremendously’ from in-kind donations; however, these results varied from 40% in the Bay Area to only 6% in Montréal. Only 10% of businesses reported benefiting ‘very much’ or ‘tremendously’ form in-kind donations. Businesses and organizations both commonly rely on networking and partnerships for their UA projects. Nearly two-thirds of organizations and half of all businesses indicated that they rely ‘very much’ or ‘tremendously’ from networking or partnership, and half of all businesses and organizations would benefit ‘very much’ or ‘tremendously’ from better networking.. 5. Staffing and Volunteer Labor Organizations appear to rely heavily on volunteer labor for their UA projects, but businesses less so. When asked how much their UA projects rely on volunteers or community engagement, nearly 80% of respondents from organizations indicated ‘very much’ or ‘tremendously’ with little variation across cities and regions, compared to just 28% of businesses. Half of all businesses indicated that they involved zero to five volunteers in their projects during 2012, whereas the median number of volunteers among organizations was 26-50 (Figure 5.1). Over one quarter of organizations involved more than 100 volunteers, compared to just 4% of businesses. Between half and two-thirds of the organizations in the different cities and regions affirmed that they would benefit ‘very much’ or ‘tremendously’ from more volunteers, compared to one-third of all businesses.. 50%. Organizations. Businesses. 19%. 13%. 20%. 19%. 13%. 11%. 16% 15%. 8%. 7%. 6%. 4%. 0%. 0 to 5 . 6 to 10. 11 to 25 . 26 to 50. 50 to100. 100 to 200. More than 200. Figure 5.1: Number of volunteers involved in urban agriculture projects during 2012. In contrast to this reliance on volunteer labor, many of the UA organizations we surveyed do not rely greatly on paid employees. About one-third of organizations indicated that they do not employ any paid labor to work on UA projects. Organizations employ a median of three employees throughout their entire organization, and a median of 2 employees who are paid to work on UA projects. Similarly, surveyed businesses employ a median of two employees total, and a median of 1.5 who are paid to work on UA projects.. 12.
(16) Over half of all businesses responded that all of their employees work on UA projects, whereas it was more common for organizations in all the major cities and regions to employ additional staff who do not work on UA projects. This was particularly apparent amongst Montréal organizations, where 93% of respondents indicated that had more employees working for the organization than the number who were paid to work on UA projects (Figure 5.2). Further, all of the Montréal organizations indicated that they employ at least one paid employee who works on UA projects.. 100%. 93%. No Employees. 80%. All employees work on urban agriculture projects. 60%. Have more employees in organization than those working on urban agriculture projects. 55%. 50%. 44%. 40%. 44%. 43%. 39%. 42%. 37%. 35%. 32%. 29% 27%. 22%. 20%. 49%. 20%. 17%. 8%. 7%. 8%. 0%. 0%. Bay Area. Portland. Montréal. Other US. Other Canada Organizations. Businesses. Figure 5.2: Percentage of respondents with paid employees working on urban agriculture projects. 6. Relationship to Government Support and Policy Survey results suggest that the relationships between UA organizations and government policy differ between North American cities. As Figure 6.1 shows, relatively few organizations in Montréal stated that their UA projects had been hindered by government policies, whereas over one quarter of organizations in Portland and over two-thirds of Bay Area organizations affirmed that they had been hindered by government policies. On average, nearly half of all businesses and organizations expressed that their UA projects have been hindered by government policy in some way, and over one-third noted that they would benefit ‘very much’ or ‘tremendously’ from changes in existing laws.. 13.
(17) 100%. 80%. 67%. 60%. 49%. 40%. 44%. 43%. 48%. 27%. 14%. 20%. 0%. Bay Area. Portland. Montréal. Other US Other Canada Organizations Businesses. Figure 6.1: Hindrance by government policies. We asked, “Have your organization's urban agriculture projects been hindered by any government policies (municipal, county/regional, state/provincial, and/or federal)?” This chart shows affirmative responses.. Access to Land. 56%. 18%. Water. 49%. 15%. Municipal Grants. 39%. 12%. Infrastructure. 31%. 6%. State / Provincial Grants. 29%. 9%. Funded Staff. 27%. 6%. Federal Grants. 26%. 9%. Zoning. 20%. Training. 20%. 15%. County/Regional Grants. Maintenance. 19%. 6%. 16%. 0%. Livestock Ordinances. 15%. Liability Insurance. 15%. Sales Ordinances. Marketing Opps. Tax Breaks. Other. Ownership of Land. Fast-Tracked Permitting. 38%. 9%. 14%. 24%. 29%. 14%. 18%. 11%. 9%. 8%. 15%. 6%. 6%. 5%. 3%. Organizations. Businesses. Figure 6.2: Percentage of respondents who have received various types of government support. 14.
(18) At the same time, many businesses and organizations receive support from government. For instance, over half of all organizations responded that they receive access to land from government, and nearly half received water from government (Figure 6.2). Over one-third of organizations also receive municipal grants. The most common types of support received by businesses were related to zoning and ordinances. Different types of government support appear to be more or less common among different cities. For instance, none of the Montréal organizations reported receiving help with fast-tracked permitting, zoning tax breaks, liability insurance or training, but they more commonly reported receiving government grants. In the Bay Area, nearly three quarters of all organizations were granted access to land by government, half of all organizations are supported by government funded staff, and half received federal grants. Portland organizations appear to have more commonly received county or regional government grants than organizations from other cities.. 7. Needs Respondents were asked to assess on a scale of 1 to 5, how much their organization would benefit from seven types of support (see Table 7.1). A score of 1 signified ‘not at all’, and 5 signified ‘tremendously’. Among organizations, three types of support resulted in an average score of 3.5 or greater: the need for more private funding; the need for more government funding; and the need for more volunteers. ‘More government funding’ scored particularly high among Montréal organizations, whereas ‘more private funding’ scored very high in the other US cities outside of Portland and the Bay Area. The need for access to more space also scored high in Montréal and other Canadian cities. Among businesses, there were two types of support that resulted in an average of 3.5 or greater: better networking; and marketing / business support. The need for better networking also scored high among organizations in Portland and Montréal.. Table 7.1: Degree to which respondents feel they would benefit from various types of support. Type of support Changes in existing laws More volunteers Better networking More government funding More private funding Marketing / Business support More extension / skills training Access to more space. Businesses. Orgs.. --- mean ** --3.3 3.0 3.0 3.7 3.5 3.4 3.2 3.7 3.3 3.9 3.5 3.0 3.1 3.0 3.1 3.6. Bay Other Other Portland Montréal Area US Canada ------------------------- mean ** ---------------------3.0 2.4 3.3 2.7 2.5 3.9 3.7 3.7 3.4 3.7 3.1 3.6 3.4 3.5 3.2 3.3 3.0 3.9 4.3 3.7 3.7 3.5 4.2 3.5 3.8 3.1 2.4 3.3 2.2 3.4 2.8 2.7 3.1 2.8 3.4 3.5 3.5 3.5 3.9 4.2. ** 1 = Not at all; 2 = Only a little; 3 = Somewhat; 4 = Very much; 5 = Tremendously. 15.
(19) 8. Conclusion This report is simply a “first cut” analysis of survey responses. We want to reiterate that the descriptive statistics presented here are based on the responses that we received, and are not intended to be entirely representative of all urban agriculture projects, practices, organizations, or groups operating in North America. Nevertheless, these preliminary results point to noticeable trends that we intend to pursue with additional interpretation, analysis, and research. Data suggest that although there is substantial variation in the ways that UA is practiced by different organizations in different cities, some common trends rise to the fore. A wide range of interests, concerns, and values motivates those organizations and businesses practicing UA, but the most common are community building, sustainability, food quality, and sustainability. Most of our respondents engage in more than one activity, and typically do so at more than one location. Residential yards and vacant lots are the most common sites of production. Most of these businesses and organizations allocate less than their entire budget to UA, which suggests that UA is typically not the only focus of the groups practicing it. Many businesses and organizations also noted that networks or partnerships are very important to their projects. Groups face many similar challenges in terms of funding, labor, and access to space, but some barriers and needs are greater in some cities than in others. Funding for their UA projects – if there is any at all – may come from numerous different sources and, in some cases, the source of funding impacts the type of UA practiced. At the same time, responses reveal distinct differences between the UA organizations in different cities. For instance, Montréal organizations typically practice UA on much less total area than organizations in other cities typically do, whereas the average total area reported by Portland organizations is considerable higher. Bay Area organizations tend to practice UA on more individual sites than organizations in other cities. There are also distinct trends that differentiate the way that businesses practice UA as compared to other types of organizations. For instance, market gardening is a primary focus for most businesses, while education is a primary activity for organizations. Organizations reported being much more reliant on grants and donations, and tend to rely much more heavily on volunteer labor for their UA projects than do their business counterparts. Finally, the spaces and land use zoning of the sites where businesses and organizations practice UA are different, with businesses more commonly practicing UA on single family residential and commercially zoned land, and organizations more commonly using public land for UA projects. To conclude, our preliminary analysis sheds light on the diversity of the UA landscape in North America. From beekeeping on balconies to vegetable production on multi-acre farms, UA incorporates a broad range of practices on a diversity of types of urban spaces. We are now interpreting these results, as well as digging deeper into our comparative assessment of UA in certain cities in the US and Canada, so stay tuned for publications. And as we move forward with this work, we welcome your comments and feedback.. 16. View publication stats.
(20)
Figure


+7


Documents relatifs
Optionally, the system may contain heaters that maintain components within operational temperatures, ther- mal storage devices that can absorb the waste heat
allocate funds for the UNPCB to provide of advisory services to its members, citing the Union’s lack of capacity. Instead, AFD set up the PA-OPA to strengthen the
Alors son exaspération retombait comme un soufflé; elle était émue, se disant qu’après tout il ne faisait rien de mal et elle n’osait pas trop le réprimander pour n’avoir pas
advice Financing Processing Marketing Social safety Live hood improv nt Public policy International negotiations Provision of public goods Informat ion communi cation
Suite à ces définitions, il apparaît que bon nombre d’éducateurs travaillant dans le soutien à la parentalité le font dans une optique de prévention tertiaire (comme ceux
However, as an example, an OSS community may have different projects (e.g. different software products with different goals) and therefore a project does not correspond to
ﺳوﻷا برﻐﻣﻟﺎ نﺎز ﻲﻧﺑ ﺔﻟودو ﻰﻧدﻷا برﻐﻣﻟﺎ ﺔ ﺻﻔﺣﻟا ﻟﺎﺻﻔﻧا روﻓ ةرﯾﺧﻷا ﻩذﻫ تﻌﺳ دﻗو ﺎﻬ ﻰﻟا لﻼﺣﻧﻻا ﻲﻓ ةذﺧﻵا ﺔ دﺣوﻣﻟا ﺔﻟودﻟا نﻋ ﻞﺣﻣ ﺳوﻟا ﻲﻓارﻐﺟﻟا ﺎﻬﻌﻗوﻣ ﻰﻠﻋ
Cardiovascular pre-participation screening of young competitive athletes for prevention of sudden death: proposal for a common European protocol: Consensus Statement of the
![[PDF] Programmation-objet-et-JAVA(Jean-Berstel) | Cours java](data:image/gif;base64,R0lGODlhAQABAIAAAP///wAAACH5BAEAAAAALAAAAAABAAEAAAICRAEAOw==)