Pépite | Un modèle basé sur la donnée pour modéliser la demande d’eau domestique dans le territoire palestinien
137
0
0
Texte intégral
(2) Thèse de Fayez El Masri, Lille 1, 2016. Abstract Water scarcity and increasing water demand especially for residential use are major challenges facing Palestine. The need to accurately forecast water consumption is useful for the planning and management of this natural resource. The main objective of this research is to (i) study the major factors influencing the water consumption in Palestine, (ii) understand the general pattern of Household water consumption, (iii) assess the possible changes in household water consumption and suggest appropriate remedies and (iv) develop prediction model based on the Artificial Neural Network to the water consumption in Palestinian cities. The research is organized in four parts. The first part includes literature review of household water consumption studies. The second part concerns data collection methodology, conceptual frame work for the household water consumption surveys, survey descriptions and data processing methods. The third part presents descriptive statistics, multiple regression and analysis of the water consumption in the two Palestinian cities. The final part develops the use of Artificial Neural Network for modeling the water consumption in Palestinian cities.. Keywords Water Management; Domestic water; Demand modeling; Consumption; ANN; Palestine.. © 2016 Tous droits réservés.. lilliad.univ-lille.fr.
(3) Thèse de Fayez El Masri, Lille 1, 2016. Résumé La pénurie d'eau et l'augmentation de la demande en eau, en particulier pour un usage résidentiel sont les principaux défis auxquels sont confrontés la Palestine. La nécessité de prévoir avec précision la consommation d'eau est utile pour la planification et la gestion de cette ressource naturelle. L'objectif principal de cette recherche est de (i) étudier les principaux facteurs qui influent la consommation d'eau en Palestine, (ii) de comprendre le schéma général de la consommation d'eau des ménages, (iii) d'évaluer les éventuels changements dans la consommation d'eau des ménages et de proposer des solutions appropriées et (iv) élaborer un modèle de prédiction de la consommation d'eau dans les villes palestiniennes basé sur le Réseau de Neurones Artificiels. Le travail de recherche est organisé en 4 parties. La première partie comprend une analyse bibliographique des travaux réalisés sur la consommation d'eau des ménages. La deuxième partie concerne la collecte de données, la méthodologie, l’enquête sur la consommation d'eau des ménages et le traitement de données. La troisième partie présente une analyse statistique des données de consommation d'eau dans deux villes palestiniennes. La dernière partie développe la modélisation de la consommation d'eau dans les deux villes à l’aide des Réseaux de Neurones Artificiels.. Mots clés Gestion de l'eau; Domestique; Prévision; Demande Modélisation; Consommation; ANN; Palestine.. © 2016 Tous droits réservés.. lilliad.univ-lille.fr.
(4) Thèse de Fayez El Masri, Lille 1, 2016. Table of Contents List of Abbreviations .................................................................................................................................. VIII General Introduction..................................................................................................................................... 1 Objective of Study ......................................................................................................................................... 3 Research layout............................................................................................................................................. 3 Research Methodology ................................................................................................................................. 4. 1. Urban Water Management: Literature Review............................................................... 5. 1.1 Introduction ...................................................................................................................................... 5 1.2 Factors Affecting Urban Water Demand........................................................................................... 7 1.2.1 Overview ................................................................................................................................... 7 1.2.2 Lack of Data in Developing Countries ..................................................................................... 11 1.2.3 Household Demographic Indicators ........................................................................................ 11 1.2.4 House Hold Income ................................................................................................................. 12 1.2.5 Household Size ........................................................................................................................ 14 1.2.6 Area of the Household............................................................................................................. 15 1.2.7 Water Price.............................................................................................................................. 16 1.2.8 Climate Factors ....................................................................................................................... 17 1.3 Urban Water Management in Palestine ......................................................................................... 17 1.3.1 History overview...................................................................................................................... 17 1.3.2 Current Water Management Models in Palestine .................................................................. 18 1.4 Use of Artificial Neural Networks in Urban Water Management ................................................... 19 1.5 Conclusion ....................................................................................................................................... 20. 2. Description of the Cases Study Areas: Cities of Ramallah and Khan Younis ..... 22. 2.1 Introduction .................................................................................................................................... 22 2.2 Water issue in Palestine .................................................................................................................. 22 2.2.1 Palestine’s Profile .................................................................................................................... 22 2.2.2 Climate .................................................................................................................................... 23 2.2.3 Water in Palestine ................................................................................................................... 24 2.3 Presentation of the City of Ramallah .............................................................................................. 26 2.3.1 Location ................................................................................................................................... 26 2.3.2 Land Use .................................................................................................................................. 27 2.3.3 Natural Environment ............................................................................................................... 27 2.3.4 Demographic and Socio-Economic data ................................................................................. 28 2.3.5 Water in Ramallah .................................................................................................................. 31 2.4 Presentation of the City of Khan Younis ......................................................................................... 37 2.4.1 The Gaza Strip Background ..................................................................................................... 37 2.4.2 Khan Younis City ...................................................................................................................... 39 2.4.3 Land Use .................................................................................................................................. 40 2.4.4 Demographic and social characteristics ................................................................................. 41 2.4.5 Water sources, quality and access .......................................................................................... 42 I|Page © 2016 Tous droits réservés.. lilliad.univ-lille.fr.
(5) Thèse de Fayez El Masri, Lille 1, 2016. 2.4.6 Water usage categories .......................................................................................................... 45 2.4.7 Khan Younis Water Distribution System Situation .................................................................. 45 2.5 Conclusion ....................................................................................................................................... 46. 3. Data Collection and Global Analysis of Water Consumption ................................... 47. 3.1 Introduction .................................................................................................................................... 47 3.2 Ramallah City .................................................................................................................................. 47 3.2.1 Global Overview of the Water Consumption .......................................................................... 47 3.2.2 Physical Characteristics of housing units ................................................................................ 49 3.2.3 Socioeconomic indicators ........................................................................................................ 53 3.2.4 Climate indicators ................................................................................................................... 57 3.2.5 Analysis of the influence of physical and socio-economic parameters on water consumption 60 3.3 Khan Younis City.............................................................................................................................. 66 3.3.1 Global Overview of Water Consumption in Khan Younis ........................................................ 66 3.3.2 Physical parameters of habitation units ................................................................................. 69 3.3.3 Socioeconomic indicators ........................................................................................................ 72 3.3.4 Influence of physical and socio-economic parameters on water consumption ...................... 78 3.4 Conclusion ....................................................................................................................................... 83. 4. Water Demand modeling using the Artificial Neural Network Method ............... 85. 4.1 Introduction .................................................................................................................................... 85 4.2 Presentation of the Artificial Neural Networks (ANN) .................................................................... 85 4.2.1 Feed Forward Neural Networks (FFNN) ...................................................................................... 86 4.2.2 Radial Basis Neural Networks (RBNN) ........................................................................................ 87 4.2.3 Generalized Regression Neural Network (GRNN) ....................................................................... 88 4.3 The performances of ANN models .................................................................................................. 89 4.4 Analysis of the water consumption in Ramallah............................................................................. 91 4.4.1 Input Variables and Data............................................................................................................. 91 4.4.2 Model Structure and Data reparation ........................................................................................ 92 4.4.3 Models based on one input variable .......................................................................................... 93 4.4.4 Models with Multiple input variables ......................................................................................... 96 4.4.4.1 Model (A): habitation parameters .............................................................................................. 96 4.4.4.2 Model (B): socio-economic parameters...................................................................................... 99 4.4.4.3 Model (C) climate parameters .................................................................................................. 102 4.4.4.4 Model (D) habitation and socio-economic parameters ............................................................ 105 4.4.5 Multiple Linear Regression (MLR) ............................................................................................. 108 4.5 Analysis of the water consumption in Khan Younis ...................................................................... 109 4.5.1 Input Variables and Data........................................................................................................... 109 4.5.2 Model Structure and Data reparation ...................................................................................... 110 4.5.3 Modeling based on one input variable ..................................................................................... 111 4.5.4 Models with Multiple input variables ....................................................................................... 112 4.5.4.1 Model (A) habitation parameters ............................................................................................. 113 II | P a g e © 2016 Tous droits réservés.. lilliad.univ-lille.fr.
(6) Thèse de Fayez El Masri, Lille 1, 2016. 4.5.4.2 Model (B) the socio-economic parameters .............................................................................. 115 4.5.4.3 Model (C) climate parameters .................................................................................................. 117 4.5.4.4 Model (D) habitation and socio-economic parameters ............................................................ 119 4.5.5 Modeling based on Multiple Linear Regression (MLR) ............................................................. 121 4.6 Conclusion ..................................................................................................................................... 121 General Conclusion ................................................................................................................................... 123 References ................................................................................................................................................ 125. III | P a g e © 2016 Tous droits réservés.. lilliad.univ-lille.fr.
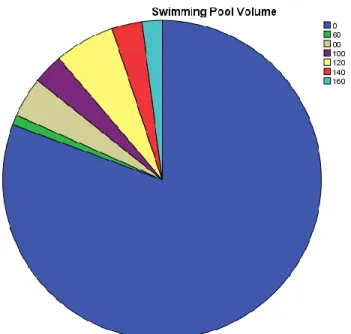
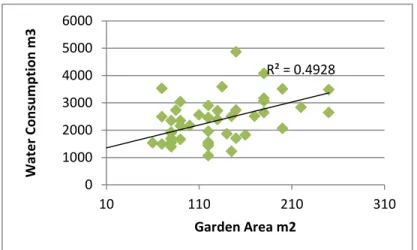
(7) Thèse de Fayez El Masri, Lille 1, 2016. List of Figures Figure 1.1 Urbanization trends and estimates in major regions of the world (in % from 1950 to 2050). Source: UN-DESA (2010) and UN-DESA (2011) ............................................................................................. 5 Figure 1.2 Global water consumption 1900 -2025 ....................................................................................... 7 Figure 2.1 State of Palestine location globally ............................................................................................ 23 Figure 2.2 Location of the City of Ramallah ................................................................................................ 26 Figure 2.3: population distribution in Ramallah city for 2015 (PCBS report 2015) .................................... 29 Figure 2.4: working domains in Ramallah city ............................................................................................ 30 Figure 2.5: Palestinian wells in Ramallah and Al-Bireh Governorate (HWE, 2009) .................................... 33 Figure 2.6: Governorates of the Gaza Strip Map ........................................................................................ 37 Figure 2.7: Khan Younis governorate satellite image. (MOLG, 2012). ........................................................ 41 Figure 2.8: Schematic structure of aquifers in the Gaza Strip (Source: Dan, Greitzer 1967) ..................... 43 Figure 3.1: the distribution of water consumption during the period 2010-2013 (Ramallah) ................... 48 Figure 3.2 : The yearly mean distribution of water consumption during the period (2010-2013) ............ 49 Figure 3.3:Type of building (percentage) .................................................................................................... 49 Figure 3.4 : Distribution of building according to their surface area .......................................................... 50 Figure 3.5 : Relationship between habitation units and the garden surface ............................................. 51 Figure 3.6 : Distribution of building according to their swimming pool volume ........................................ 52 Figure 3.7 : Repartition of the habitation units according to household size ............................................ 54 Figure 3.8 : Distribution of the households according to the education level ........................................... 55 Figure 3.9: Distribution of households according to their Annual Income................................................. 56 Figure 3.10 : Distribution of households according to cars number .......................................................... 56 Figure 3.11: Monthly Mean temperatures in Ramallah (2010 – 2013) ...................................................... 58 Figure 3.12: Variation of humidity in Ramallah .......................................................................................... 59 Figure 3.13: Monthly Rainfalls in Ramallah (2010 – 2013) ......................................................................... 59 Figure 3.14: Variation of the water consumption in dwelling habitation .................................................. 60 Figure 3.15: Variation of the water consumption in house habitation ...................................................... 61 Figure 3.16: Relationship between the water consumption and the habitation surface area................... 61 Figure 3.17: Relationship between the water consumption and the garden area..................................... 62 Figure 3.18: Relationship between the water consumption and swimming pool volume ......................... 62 Figure 3.19: Relationship between the water consumption and the household size ................................ 63 Figure 3.20: Relationship between the water consumption and education level of household................ 63 Figure 3.21: Relationship between the water consumption and annual household income..................... 64 Figure 3.22: Relationship the relationship between the water consumption and number of cars ........... 64 Figure 3.23: Relationship between the water consumption and mean temperature ................................ 65 Figure 3.24: Relationship between the water consumption and humidity ................................................ 65 Figure 3.25: Relationship the relationship between the water consumption and mean rainfall............... 66 Figure 3.26: The distribution of water consumption during the period 2011-2014 .................................. 67 Figure 3.27: The distribution of water consumption with type of building................................................ 69 IV | P a g e © 2016 Tous droits réservés.. lilliad.univ-lille.fr.
(8) Thèse de Fayez El Masri, Lille 1, 2016. Figure 3.28: Type of building (percentage) ................................................................................................. 69 Figure 3.29: Distribution of building according to their surface area ......................................................... 70 Figure 3.30: Distribution of building according to their garden area ......................................................... 71 Figure 3.31 :Distribution of household according to their size................................................................... 73 Figure 3.32: Distribution of households according to their education level .............................................. 74 Figure 3.33 Distribution of building according to their Annual Income ..................................................... 75 Figure 3.34: Distribution of building according to cars number ................................................................. 75 Figure 3.35: Mean temperatures in Khan Younis (2011 – 2014) ................................................................ 77 Figure 3.36: Variation of the mean humidity in Khan Younis (2011 – 2014) .............................................. 77 Figure 3.37: Variation of the rainfall in Khan Younis (2011 – 2014) ........................................................... 78 Figure 3.38: The variation of water consumption with dwelling and houses habitation ........................... 79 Figure 3.39: The relationship between the water consumption and building surface area ...................... 79 Figure 3.40: The relationship between the water consumption and garden area ..................................... 80 Figure 3.41: The relationship between the water consumption and number of people ........................... 80 Figure 3.42: The relationship between the water consumption and the education level ......................... 81 Figure 3.43: The relationship between water consumption and annual family income ............................ 81 Figure 3.44: Relationship between the water consumption and number of cars ...................................... 82 Figure 3.45: Relationship between the water consumption and mean temperature ................................ 82 Figure 3.46: Relationship between the water consumption and humidity ................................................ 83 Figure 3.47: The relationship between the water consumption and mean rainfall ................................... 83 Figure 4.1: General structure of FFNN ........................................................................................................ 86 Figure 4.2: General structure of RBNN ....................................................................................................... 87 Figure 4.3 :General structure of GRNN ....................................................................................................... 89 Figure 4.4: Monthly water consumptions in Ramallah city (period 2010 – 2013) ..................................... 92 Figure 4.5: Results of ANN modeling for models M2, M5, M1 and M3 (input parameters are given in table 4.3). .................................................................................................................................................... 95 Figure 4.6: Results of the best model M14 based on a habitation parameters Model A ........................... 97 Figure 4.7: Results of the best model M21 based on socio-economic parameters (Model B) ................ 100 Figure 4.8 : Results of the best model M25 based on climate parameters (Model C) ............................. 103 Figure 4.9: Performances of the ANN models using habitation and socio economic parameters (Model D) .................................................................................................................................................................. 106 Figure 4.10: Performances of the model M32 - habitation and socio-economic parameters (ANN models based on habitation and socio-economic parameters (Model D) ............................................................ 107 Figure 4.11: Performance results - correlation coefficient R for MLR model ........................................... 109 Figure 4.12: results obtained with the model M4, which provides the best results ................................ 112 Figure 4.13: the results of the best model M11 based on a habitation parameters Model A ................. 114 Figure 4.14: Results of the best model M14 based on socio-economic parameters (Model B)............. 116 Figure 4.15: Results of the best model M19 based on climate parameters (Model C ) ........................... 118 Figure 4.16: Performances M26 model D habitation and socio-economic parameters........................... 120 Figure 4.17: Performance results - correlation coefficient R for MLR model ........................................... 121. V|Page © 2016 Tous droits réservés.. lilliad.univ-lille.fr.
(9) Thèse de Fayez El Masri, Lille 1, 2016. List of Tables Table 2.1: Annual Growth Rates in Palestine, 2013-2015 (PCBS report 2015) ........................................... 23 Table 2.2: Climate indicators of Palestine in 2015 (PMA report 2015) ...................................................... 24 Table 2.3: Percentages of Households in Palestine by the Main Mean of Obtaining Water, 2015............ 25 Table 2.4: Data concerning water resources in Palestine ........................................................................... 25 Table 2.5: Land distribution in Ramallah (Municpality of Ramallah,2015) ................................................. 27 Table 2.6: Population in Ramallah city (PCBS report 2012) ........................................................................ 29 Table 2.7: Water indicators in Ramallah and Al Bireh Governorate, 2010 ................................................. 34 Table 2.8: Water tariff structure ................................................................................................................. 36 Table 2.9: Amount of water uses in Gaza Strip (CMWU, 2011) .................................................................. 38 Table 3.1: the statistical parameters for yearly consumption water in Ramallah (m3) .............................. 48 Table 3.2: Pearson correlation Matrix between physical parameters of the habitation units................... 53 Table 3.3: Categories of households according to their income ................................................................ 55 Table 3.4: Pearson correlation Matrix between physical and socioeconomic parameters........................ 57 Table 3.5: The statistical parameters for yearly consumption water (m3) ................................................ 67 Table 3.6: Pearson correlation Matrix between physical parameters........................................................ 71 Table 3.7: Percentage of sub-classes of annual income for families .......................................................... 74 Table 3.8: Correlation Matrix between physical and socioeconomic parameters ..................................... 76 Table 4.1: The Statistical parameters for data sets .................................................................................... 91 Table 4.2: the scenarios tested in the model.............................................................................................. 93 Table 4.3: ANN models based on a single input variable............................................................................ 94 Table 4.4: Performances of ANN models based on a single input variable ................................................ 94 Table 4.5: ANN models based on habitation parameters (Model A).......................................................... 96 Table 4.6: Performances of ANN models based on habitation parameters (Model A) .............................. 96 Table 4.7: The weights of the ANN model M 14 ......................................................................................... 98 Table 4.8: Ranking analysis of model M14.................................................................................................. 98 Table 4.9: ANN models based on socio-economic parameters (Model B) ................................................. 99 Table 4.10: Performances of ANN models based on socio-economic parameters (Model B) ................... 99 Table 4.11: The weights of the ANN model M 21 ..................................................................................... 101 Table 4.12: Ranking analysis of model M21 ............................................................................................. 101 Table 4.13: ANN models based on C climate parameters (Model C)........................................................ 102 Table 4.14: Performances of ANN models based on C climate parameters (Model C) ............................ 102 Table 4.15: the weights of the ANN model M25 ...................................................................................... 104 Table 4.16: Ranking analysis of model M25 ............................................................................................. 104 Table 4.17: ANN models based on habitation and socio-economic parameters (Model D) .................... 105 Table 4.18: Performances of ANN models using habitation and socio economic parameters (Model D)106 Table 4.19: the weights of the ANN model M32 ...................................................................................... 108 VI | P a g e © 2016 Tous droits réservés.. lilliad.univ-lille.fr.
(10) Thèse de Fayez El Masri, Lille 1, 2016. Table 4.20: Ranking analysis of model M32 provided the following result .............................................. 108 Table 4.21: Statistical parameters for the input parameters – Khan Younis ............................................ 110 Table 4.22: Scenarios tested in the ANN model (Khan Younis) ................................................................ 110 Table 4.23: ANN models based on a single input variable (Khan Younis) ................................................ 111 Table 4.24: Performances of ANN models based on a single input variable (Khan Younis) ..................... 111 Table 4.25: ANN models based on habitation parameters (Model A) (Khan Younis) .............................. 113 Table 4.26: the structures of forecasting model B socio-economic parameters...................................... 115 Table 4.27: ANN models based on C climate parameters (Model C) (Khan Younis) ................................ 117 Table 4.28: ANN models based on habitation and socio-economic parameters (Model D) .................... 119. VII | P a g e © 2016 Tous droits réservés.. lilliad.univ-lille.fr.
(11) Thèse de Fayez El Masri, Lille 1, 2016. List of Abbreviations ANNs. Artificial Neural Networks. CMWU. Coastal Municipalities Water Utility. FFNN. Feed Forward Neural Networks. GRNN. Generalized Regression Neural Networks. IPCC. Intergovernmental Panel on Climate Change. JWU. Jerusalem Water Undertaking. MCM. Million cubic meters. MDPS. Medium Term Development Palestinian government strategy. PC. Pearson correlation. PCBS. Palestinian Central Bureau of Statistics. PMA. Palestinian Meteorological Authority. PNA. Palestinian National Authority. PWA. Palestinian Water Authority. RBNN. Radial Basis Neural Networks. UN. United Nations. UNRWA United Nations Relief and Works Agency UPVC. Unplasticised Poly Vinyl Chloride. UWM. Urban Water Management. WB. World Bank. WBWD. West Bank Water Department. WHO. World Health Organization’s. WSSA. Water Supply and Sewage Authority. VIII | P a g e © 2016 Tous droits réservés.. lilliad.univ-lille.fr.
(12) Thèse de Fayez El Masri, Lille 1, 2016. General Introduction As the world population becomes more urbanized, the social, economic, and environmental vitality of our growing cities are all dependent upon urban management of water. The water sector and the development community have a symbiotic relationship which usually goes unrecognized, and therefore, is not realized. Without adequate water resources and water infrastructure, urban development and redevelopment can be stymied. On the other hand, land use and development impact the use and the need for water. It takes more than turning on the tap to bring safe, reliable drinking water to an urban area. An approach which exploit the water managers is Urban Water Management (UWM), sometimes also called One Water. UWM principles recognize that water from all sources must be managed holistically and cooperatively to meet social, economic, and environmental needs. Predicting and managing urban water demand is complicated by the tightly coupled relationship that exists between human and natural systems in urban areas. This relationship results from multiple interactions between microscale (individual, household, or parcel level) and macroscale (municipal or regional) processes and patterns. For example, in complex systems, local interactions among individuals cumulate over space and time, generating mesoscale and macroscale variables that in turn feedback to influence or constrain individual choices [Liu et al., 2007; Irwin et al., 2009]. This embedded nature of social and ecological systems in natural resource management poses a significant challenge to water managers. Separate analysis of these systems is not feasible; accounting for the complex and often unpredictable reactions to various shocks, policies, and interventions remains extremely difficult [Berkes and Folke, 2001; Irwin et al., 2009]. Analyzing and forecasting urban water demand is a complex yet imperative task, as it is essential that cities meet the water demands of their residents. The ability to estimate water demand under multiple climate, population growth, and conservation scenarios is intimately tied to urban hydrological processes and modeling. Peak water demand forecasts influence infrastructure expansion strategies. Many urban areas face similar stresses and will require expansion of water supply and distribution facilities. Ensuring a least cost and reliable 1|Page © 2016 Tous droits réservés.. lilliad.univ-lille.fr.
(13) Thèse de Fayez El Masri, Lille 1, 2016. infrastructure expansion strategy requires an accurate estimate of the required size and operation of reservoirs, pumping stations, and pipe capacities. The first step is to develop an accurate and a reliable water demand forecast models, especially for assessing peak demand. There are two types of demand forecasting. The first are short‐term forecasts, which are used for operation and management. The second are the long‐term forecasts, which are required for planning and infrastructure design [Bougadis et al., 2005]. Currently, water managers produce demand estimates using a long‐term climate trends and the principle of stationarity (the idea that natural systems fluctuate within an unchanging envelope of variability) [Milly et al., 2008]. However, climate change introduces uncertainties that may limit the accuracy of this method, as historical trends will no longer be reliable for predicting future climate‐sensitive water demand [Milly et al., 2008; Gober et al., 2010]. A transition in water demand modeling, forecasting, and management depends first on an understanding of the current and historical methods of acquiring and producing knowledge in the discipline. An understanding of the origin, structure, and limits of this knowledge is also required [Ward, 2007; van de Meene and Brown, 2009; Gober et al., 2010; van de Meene et al., 2010]. Water scarcity and increasing water demand especially for residential use are major challenges facing Palestine. The need to accurately forecast water consumption is useful for the planning and management of this natural resource. Residential water use studies partially enabled by modern smart metering technologies such as those provide the opportunity to align disaggregated water use demand for households with an extensive database covering household demographic, socio-economic and water appliance stock efficiency information. Artificial Neural Networks (ANNs) provide the ideal technique for aligning these databases to extract the key determinants for each water use category, with the view to build a residential water end-use demand forecasting model. This research aims at developing tools, understanding and strategy for the water policy in the urban area in Palestine. The use of water in urban area constitutes a strategic issue for the Palestinian Authority. In order to analyze this use and to understand its drivers as well as 2|Page © 2016 Tous droits réservés.. lilliad.univ-lille.fr.
(14) Thèse de Fayez El Masri, Lille 1, 2016. barriers, we conducted field studies in two cities in Palestine. The first city is Ramallah, which is located in the West Bank of Jordan and considered as the administrative center of the Palestinian authority. The second city is Khan Younis, which represents the Gaza strip, it is known for the high population density, poor economic and environmental conditions and lack of water resources. Comprehensively understanding of water consumption behavior is necessary to design efficient and effective water strategy. Despite global efforts to identify the factors that affect domestic water consumption, those related to domestic water use in Palestine have not been sufficiently studied, particularly in districts that have developed access to improved water supply. To address this gap, this study will analyze the water use in 100 households in Ramallah city and 100 households in Khan Younis city.. Objective of Study The main objective of this research is to: Study the major factors influencing the water consumption in Palestine. Understand the general pattern of Household water consumption in Palestine. Two case studies will be done - Ramallah at West Bank and Khan Younis in Gaza strip. Assess the possible changes in household water consumption and suggest appropriate remedies. Develop prediction model based on the Artificial Neural Network to the water consumption in Ramallah and Khan Younis.. Research layout The study is organized as follow: Chapter 1 is devoted to literature review of household water consumption studies and water issues. Data collection, methodology, conceptual frame work for the household water consumption surveys, survey descriptions and data processing methods are presented in Chapter 2. 3|Page © 2016 Tous droits réservés.. lilliad.univ-lille.fr.
(15) Thèse de Fayez El Masri, Lille 1, 2016. Chapter 3 presents descriptive statistics, multiple regression and analysis of the water consumption in the two case studies. Chapter 4 develops the Artificial Neural Network modeling of the water consumption in Ramallah and Khan Younis.. Research Methodology Conceptual framework was developed based on the literature review and a research model was recognized showing the relationship between input variables and water consumption and then artificial neural network model for prediction was developed.. Physical/Technical Factors Socioeconomic Factors. Household Consumption of Water. Climate Factors. 4|Page © 2016 Tous droits réservés.. lilliad.univ-lille.fr.
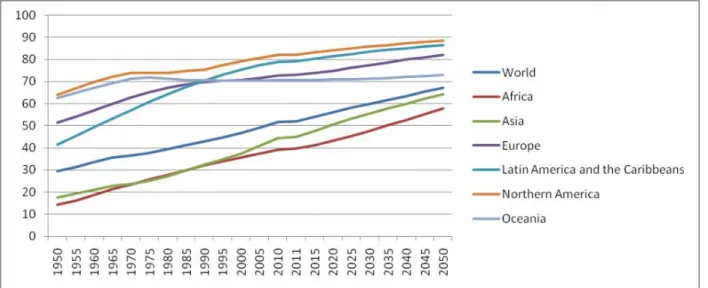
(16) Thèse de Fayez El Masri, Lille 1, 2016. 1 Urban Water Management: Literature Review 1.1 Introduction According to the U.N.’s Millennium Development Report (2010), the urban population was projected to exceed the rural population in developing regions of the world. Urban populations were growing at more than 3 percent per annum in 2012, three times faster than the populations in rural areas. More than one-third of city dwellers - almost 1 billion people - lived in conditions characterized by overcrowding and poor water services. For the urban poor residing, lack of water supply and sanitation services represents a frightening challenge and multiple strategically targeted initiatives will be required to meet the targets of reducing by half the proportion of people without sustainable access to safe drinking water and basic sanitation (U.N., 2010). Urbanization is one of the most important demographic trends of our time. In 2008, the number of people living in urban areas has for the first time surpassed the number of people living in rural areas. It is estimated that by 2050, the percentage of urban population will reach nearly 70% (BIRCH et al. 2012).. Figure 1.1 Urbanization trends and estimates in major regions of the world (in % from 1950 to 2050). Source: UN-DESA (2010) and UN-DESA (2011). 5|Page © 2016 Tous droits réservés.. lilliad.univ-lille.fr.
(17) Thèse de Fayez El Masri, Lille 1, 2016. Many countries in both developed and developing world face significant problems in maintaining reliable water supplies; this is expected to continue in the coming years mainly due to the impact of global climate change, the rapid population growth and the limited costeffective water supply augmentation options (Dharmaratna and Harris, 2010).. During the period 2010- 2014, the proportion of the population with access to an improved drinking water source in developing regions rose from 75% to 85%. However, nearly 1 billion people are still using water from unimproved sources such as shallow wells, rivers, streams, ponds and drainage ditches with their attendant health and safety risks. Large numbers of those who lack access to improved water supply infrastructure live in urban areas (World Bank, 2014).. As a result, reliable estimates of residential water consumption, water source choice decisions and the factors affecting it become critical for the water policy makers. On the one hand, there is a debate around whether policies aimed at reducing water consumption should use price or non-price methods. On the other hand, supply augmentation requires several years of planning and large amount of capital investments before the water is available. In light of these challenges, governments are seeking strategies that promote water conservation, particularly with residential consumers (Ibid, 2010). Water consumption analysis is doomed at providing relevant information and awareness for designing an effective water demand policy in general and a policy that seeks the efficient use of water in particular. In this way, efficient use of water is defined as a pattern of use that maximizes the payback arising from the elimination of a given water resource (Tietenberg, 1991; Pearce, 1999). As shown in Figure 1.2, global water usage continues to increase, it will be important to consider urban management as a means to deal with the problem. By reducing usage, we can mitigate the demand of water. 6|Page © 2016 Tous droits réservés.. lilliad.univ-lille.fr.
(18) Thèse de Fayez El Masri, Lille 1, 2016. Figure 1.2 Global water consumption 1900 -2025 Source: [http://www.lowimpactliving.com/pages/your-impacts/water1]. 1.2 Factors Affecting Urban Water Demand 1.2.1 Overview Water management constitutes a vital alarm for both water supply companies and public administrations due to the magnitude of water for life and current lack in many areas. Water demand management aims at motivating consumers and influencing their water use, through a range of social marketing, economic, and other management programs (Argues et al., 2003; Broody et al., 2005; Russell and Fielding, 2010). The most commonly used factors in urban water management are: number of connections or population, household size, number of households, income or factors of the standards of living, price of water, quality of water, educational level and climatic factors such as temperature and rainfall (Babel et al, 2007). Barkatullah (2002) used income and property values as indicators of the accessible resources for. households.. Höglund. (1999). included. the. average. gross. household. income;. whileGunatilakeet et al. (2001) used the household income data from a survey. Household size was frequently used in the water consumption equation (Nieswiadomy et al, 1998) as having significant influence on water consumption.. 7|Page © 2016 Tous droits réservés.. lilliad.univ-lille.fr.
(19) Thèse de Fayez El Masri, Lille 1, 2016. Renwick and Green (1999) included seasons and climate. The climate variables found to affect the water consumption by shifting soil water accessibility and evaporation rate (Fox et al., 2009; Godchild, 2003), whilerainfall was found to reduce the need for watering and other outdoor activities resulting in brief reduction in water demand (Maidu, 1990). Price is also considered as an important factor that affect water consumption, as pricing can set off consumers to adjust the way they use water thus ensuring available capacity is used competently and investments are carried out only when extremely necessary (Stephenson, 1999), (Chestnut et al., 2007) found that tariffs can be based on water metering or on a non-volumetric tariff. In case of fixed tariffs, consumers are charged a fixed amount, regardless of how much water they use. This tariff system does not encourage efficient use of water since consumers do not have an encouragement to reduce water consumption. When metering is introduced in establishing water tariffs, two schemes are usually employed in setting the tariff, the flat tariff and the blocked tariff, both have their own effects on water consumers and thus on the revenues generated by the public agency, the conservation wastage of water and the even distribution among affluent and relatively poorer users of water. Renwick and Green (1999) used median household income for each of the water agencies included based on aggregated water data. Water use practices depend highly on the household income. To better serve the low income consumers, it is often suggested that high income households, who rely on private taps, crosssubsidize poor households because a significant number of these households is unwilling or unable to pay for the water from a public tap. However, as experiences have shown, a fee on public taps is advisable because water for free leads to less sustainability, does not give any incentive for the distributor to expand networks, and might therefore be a bad policy for the poor overall (Minten et al., 2002). The challenges for understanding the dynamics of water management are complex and include the study of climate change, population growth, public attitude, urban planning and policy, and the impact on successful water management. Embedded in this complexity are the influencing residential water demands. Many studies were made in residential water demand has identified demands such as the presence of low flush toilets, dishwashers and washing 8|Page © 2016 Tous droits réservés.. lilliad.univ-lille.fr.
(20) Thèse de Fayez El Masri, Lille 1, 2016. machines as factors that influence water consumption (Malla and Gopglakrishnan 1997; Arubes et al. 2003; Domene and Sauri 2006).Furthermore, dwelling type, house size, and the number of members in the household also contribute significantly to the amount of water used (Domene and Sauri 2006; Wentz and Gober 2007). Socioeconomic factors that show a positive influence on water usage are average age of residents, educational level and household income (Chu et al. 2009; Guhathakurta and Gober 2007; Harlan et al. 2009; Kenney et al. 2008; Schleich and Hillenbrand 2009).. Studies have also shown that along with household demand, residential water usage can be characterized through seasonal changes and climate stressors. These water demands are largely for outdoor amenities, primarily pools, gardens, and irrigated landscaping (Domene and Sauri 2006; Fullerton and Nava 2003; Head and Muir 2007; Lee et al. 2008; Praskievicz and Chang 2009; Wentz and Gober 2007). Pools use a great deal of water due to evaporation but provide recreation, aesthetic value, and summer time relief to high temperature (Agthe and Billings 2002; Wentz and Gober 2007). Gardens and irrigated landscaping provide vegetation and some temperature relief through shade and evapotranspiration, but this landscaping style can be highly water intensive (Gober et al. 2010; Yabiku et al. 2008). Arbues et al. (2003) also mentioned the total size of the area to be irrigated, the presence of a garden, and whether there is a sprinkler system or not as major factors that increase outdoor residential water use. Understanding the components of indoor and outdoor water demand is crucial, studies have shown that neighborhood characteristics, spatial organization of housing, and dwelling type influence water demand (Franczyk and Chang 2009; HousePeters et al. 2010; Wentz and Gober 2007), other studies showed that neighbors tend to have similar water consumption patterns even when other factors may be different (Chang et al. 2010; Fox et al. 2009). Moreover, there are others showed that water use can be predicted by dwelling type, such as detached single structures, semi-detached, and apartment complexes (Fox et al. 2009; Randolph and Troy 2008; Zhang and Brown 2005).. 9|Page © 2016 Tous droits réservés.. lilliad.univ-lille.fr.
(21) Thèse de Fayez El Masri, Lille 1, 2016. Incorporating spatial characteristics and dwelling types are important factors for urban planners to consider in policy development and the impact of climate change on water demand. Researchers showed that domestic water consumption was significantly correlated with several factors such as water supply pattern and garden area, and significantly negatively correlated with family size and age of household head. Traditional hygiene habits and use of water appliances are dominant behaviors in the district with access to improved water supply. Recent studies on domestic water consumption payed more attention to user lifestyles (water appliance usage habits, outdoor water use) and cultural backgrounds (age, education). The main characteristics of the household head (age, gender, and educational level and socioeconomic situation (net family size, household income, vegetable garden and yard area, and possession of livestock, washing machines, and solar water heaters) also affected the water consumption. The main domestic water consumption includes: . Indoor consumption such as drinking, personal hygiene (i.e., washing face, hands, and feet), kitchen activities, showering and laundry.. . Outdoor consumption such as garden irrigation, livestock needs, house and yard cleaning.. The dominant water use behaviors include: . Indoors factors such as frequency of laundry, frequency of personal hygiene activities, water appliance usage ratio;. . Outdoors factors such as frequency of vegetable garden watering, frequency of house and yard cleaning, swimming pool and car cleaning.. 10 | P a g e © 2016 Tous droits réservés.. lilliad.univ-lille.fr.
(22) Thèse de Fayez El Masri, Lille 1, 2016. 1.2.2 Lack of Data in Developing Countries In most developing countries, the quality of datasets on residential water consumption often poses a problem for demand estimation, especially as metering is not common. In contrast to developed countries, where almost all households obtain water from the utility through a piped network, the market for residential water demand in many developing countries shows much more variation. Households may have a connection to the piped network and use water exclusively from their private tap, but they may also combine piped water with water collected from wells, public taps, or purchase water from vendors; or they may have no connection and rely exclusively on non-piped water. Little is known about households’ behavior in developing countries regarding the factors driving their choices and in particular the substitution or complementary relationships between piped and non-piped water for piped households or the combination of non-piped water from different sources for non-piped households. As a result, policy decisions are often not very well informed; it is usually assumed that residential water demand in developing countries mirrors those of developed countries (Basania et al., 2008). 1.2.3 Household Demographic Indicators Demographic factors are well known to influence the water demand (Arbués et al., 2003; Cavanagh et al., 2002; and Lyman, 2002), while aggregate data can be helpful in the investigation of this issue; customer data provide opportunities to aggregate water consumption is a function of the decisions of many individual water users, not all of whom are likely to respond to price, weather, and non-price policies equally. Not only the characteristics of these water users vary from community to community, but also they evolve within communities over longer time periods (a decade or more). Data limitations are common impediment to assess the impact of demographic characteristics on household water demand. We rarely have data sets that allow going with household level consumption data with demographic data about the people and house associated with a household water account. However, previous studies showed that household water consumption is influenced by heterogeneity associated with differences in wealth (income), 11 | P a g e © 2016 Tous droits réservés.. lilliad.univ-lille.fr.
(23) Thèse de Fayez El Masri, Lille 1, 2016. family size and age distribution, and household preference towards water use and conservation (Hankeand de Mare, 1982; Jones and Morris, 2004; Lyman, 2002; Renwick and Green, 2000; Syme et al., 2000; Cavanagh et al., 2002). Other studies investigated the effect of HH demographics on water use revealed that HH size has a positive effect on water use. However, Arbués et al. (2000) found that water use is less than proportionate to the increase in HH size or population because of economies of scale in discretionary and nondiscretionary water usage, including cooking, cleaning, car washing and gardening as there is an optimum household size beyond which these economies of scale diminishes. Families with children could be expected to use more water as children require frequent sanitations, outdoor uses by children and teenagers might be higher, young people might use water less carefully, have more showers and demand more frequent laundering, while retired people might have saving and disciplined water use behaviors (Nauges and Thomas, 2000). But, Lyman (2002) found that retired people tend to spend more time at home and do more gardening, which is associated with more water use.. 1.2.4 House Hold Income Some assess of wealth (e.g., income) is often included into water consumption studies, based on the assumption that greater wealth is likely to lead to an accumulation of water-using devices and, simultaneously, temper the influence of price in restricting water demand. Here it is worth reviewing the significance of personal wealth (income) independently as a key demographic factor in shaping demand, and consider the ways that this issue has been addressed in the literature. The income is usually measured by the total money income for the area divided per household or per capita. In household-based studies, the variable assessed value of the property is occasionally used (Howe and Linaweaver, 2007; Hewitt and Hanemann, 2005; Dandy et al., 2007; Arbués et al., 2000). This variable could be introduced in addition to income, acting as a substitute for wealth and household preferences for home life-style. However, it is usually too 12 | P a g e © 2016 Tous droits réservés.. lilliad.univ-lille.fr.
(24) Thèse de Fayez El Masri, Lille 1, 2016. correlated with income and other variables to be useful in practice (Lyman, 2002; Barkatullah, 2006). Users with high income present a lower level of perception of the rate structure, since the total bill represents a lower proportion of their income. Thus, several studies (Hanke and de Maré, 2002; Agthe and Billings, 2007, 2007; Saleth and Dinar, 2000) analyzed these income effects, estimating different consumption functions for different income levels. Income (or expenditure) and education level (or the ability of head of household to read and write) have been found to be positively associated with household choice of improved water source (Madanat and Humplick 1993; Hindman Persson 2002; Briand and others, in press; Larson and others 2006; Nauges and Strand 2007; Basani and others 2008; Nauges and van den Berg, 2009).. Piper (2003) mentioned that, “Almost all of the demand models have estimated the elasticity price of demand to be negative and inelastic and the income elasticity to be positive and inelastic. This general result has occurred in spite of the region where the study was conducted or the modeling technique used.” Cavanagh et al. (2002) reported that most income elasticity in the literature (2001 to 2011) generally fall in the range of 0.2 to 0.6. Representative studies included those by Jones and Morris (1984) (0.40 to 0.55 in Denver, depending on the price model), Cochran and Cotton (2005) (0.58 for Oklahoma City), Billings and Day (2009 in southern Arizona), Nieswiadomy (2002) (from 0.28 to 0.44 in the North Central, Northeast and South regions using the marginal price model), Renwick and Archibald (2008) (0.36, based on data from 119 single family households in two California cities over a 6-year period), and Renwick and Green (2000)(0.25 in 8 urban water agency service areas in California). Howe and Linaweaver (2007) showed a similar range over 39 areas spread across the U.S., as well as demonstrated higher income elasticity for outdoor water use than indoor use.. 13 | P a g e © 2016 Tous droits réservés.. lilliad.univ-lille.fr.
(25) Thèse de Fayez El Masri, Lille 1, 2016. 1.2.5 Household Size Two related considerations regarding family demographics and water consumption are the size of the family (number of members) and their age distribution. Several studies confirmed the intuitive hypothesis that household water consumption increases as the number of members increases (Howe and Linaweaver, 2007; Foster and Beattie, 2009; Lyman, 2002; Nieswiadomy, 2002; Renwick and Archibald, 2008; Nauges and Thomas, 2000; Cavanagh et al., 2002; and Piper, 2003). For example, Cavanagh et al. (2002) used data from 1,082 single-family homes in the U.S. and Canada, it showed that each additional household resident increases daily consumption by 22%, the increase is not one-to-one due to economies of scale i.e., doubling household members does not double water consumption, as some major water uses (notably outdoor irrigation) is not family size dependent (Hoglund, 2009).. The significance of age distribution on water demand has been studied in two investigations: Hanke and de Mare’s (2002) study of Sweden, and Lyman’s (2002) study of Moscow, Idaho. Hanke and de Mare found that the elasticity of water consumption for adults (0.13) was more than twice that for children (0.05). On the other hand, Hanke and De Mare’s study found that only distinguished between adults and children, Lyman considered adults, children and teenagers (actually ages 10 to 20), while both studies showed that adults use less water (per capita) than those under age 20, Lyman suggested that the highest users are actually children (those under age 10) and the lowest water users are teens (age 10 to 20). Lumping children and teens together, therefore, can hide an interesting water use dynamic. Lyman found that adding a child to a home increases the water usage by 2.5 times that of another teen and 1.4 times that of an adult.. Another interesting dynamic may occur as people enter retirement age. Billings and Day (2009) found the levels of water use are increased as individuals in Tucson, AZ are transitioned from the 55-64 age range to the “post-retirement” class, possibly as a stress on work gives way to 14 | P a g e © 2016 Tous droits réservés.. lilliad.univ-lille.fr.
(26) Thèse de Fayez El Masri, Lille 1, 2016. time at home and activities such as gardening. A seemingly contradictory result is found in Martinez-Epineuria’s (2002) study of northwestern Spanish cities, where per capita use is lower in cities with a high concentration of people over age 64. Some researchers have tried to use number of bathrooms as a surrogate statistic for household size; for example, Hewitt and Hanemann’s (2005) study of summer water use in Texas found the number of bathrooms has a significant effect on water consumption. However, this raised a variety of methodological questions, including the possibility that number of bathrooms is correlated with other factors, namely income.. 1.2.6 Area of the Household It is often assumed that the house size and lot size are positively correlated with indoor and outdoor water demand. Cavanagh et al. (2002), for example, found that every 1,000 square feet of house size in 11 urban areas in the U.S. and 39 in Canada increased water demand by 1315%. Others, such as Hewitt and Hanemann (2005), found no significant relationship between house size and water demand in Denton, TX. A slightly different metric of house size, number of bathrooms, also produced inconsistent results. Cavanagh et al. (2002) found that each bathroom increased the demand by 6%; Hewitt and Hanemann (2005) also found that the number of bathrooms is important and positively correlated with the water demand. However, Lyman (2002) found that by using data from 30 households in Idaho, the total number of bathrooms was negatively related to the water usage, and it was correlated with other variables such as property value. A different clearer picture exists regarding the lot size (or related measures of irrigable acreage). Studies by Lyman (2002), Renwick and Green (2000) and Cavanaghet al. (2002) found that the water demand increased with the lot size. Cavanagh et al. (2002) detected only a modest increase, concluding that each additional 1,000 square feet of lot area increased household demand by less than 1%, while Renwick and Green (2000) found that a 10% increase in lot size yielded a 2.7% increase in the water demand. However, as seen with many other 15 | P a g e © 2016 Tous droits réservés.. lilliad.univ-lille.fr.
(27) Thèse de Fayez El Masri, Lille 1, 2016. household and house variables, many researchers, including Howe and Linaweaver (2007), eventually throw irrigable acreage out of their demand model, believing it to be too closely correlated with housing value. 1.2.7 Water Price Water consumption studies overlooked the presence of block rates in general using the average price of water as the separate indicator of price (Billings and Agthe, 1980). However, as noted by Howe and Linaweaver (1967), such an approach ignored (a) the role that marginal prices play in the consumer demands and (b) a change in the marginal price of a particular block may affect in a quantity reduction demanded yet result in little to no change in the average price paid. Water consumption in most cases is estimated as rather inelastic. This is because water has no substitutes for basic uses and because the customer exhibits a low level of perception of the rate structure, since water bills typically represent a small proportion of income (Chicoineand Ramamurthy, 1986; Arbués et al., 2000). However, prices can play a crucial role in the demand management as long as the softness is different from zero.. Under block rate tariffs, it is difficult to analyze the effect of changes in the intra marginal rates, that is, rates that do not correspond to the current level of consumption. As shown in Taylor (2007), who showed that the marginal price is not affected by a change in the intra-marginal rate, the latter will only affect demand through an income effect. This finding has led to different reactions, as the lack of consumer information about the tariff structure and then the fact that the difference erratic amounts to such a small fraction of the household income have been suggested as explanations (Nieswiadomy and Molina, 2000). While a perfectly informed consumer should respond to marginal price and the rate premium (Nordin, 2000), most consumers will not dedicate much time or effort to study the structure or changes in intramarginal rates (Billings and Agthe, 2000; Bachrach and Vaughan, 2000) because of information costs. An alternative specification applied in several studies was the average price. Other authors applied both average and marginal price in the same or different models.. 16 | P a g e © 2016 Tous droits réservés.. lilliad.univ-lille.fr.
(28) Thèse de Fayez El Masri, Lille 1, 2016. Some elasticity values show that the choice of variable did not greatly affect the results, while some proposed that consumption is more approachable to average price. Another potential outcome of the lack of information by the consumers was that these could react to lag rather current average prices. Since water bills are received after a period, the issue arises of whether to use a current or lagged price specification (Arbués et al., 2000). It has been shown that consumers are not always aware of current price schedule, although the choice of the appropriate price ruins controversial (Charney and Woodard, 2000; Opaluch, 1984; Nieswiadomy and Molina, 2001).. 1.2.8 Climate Factors Water use has progressively become a greater concern to urban water resource managers, it became as concern over climate variability and change is growing and urban areas have expanded in many parts of the world during the 20th and early 21st centuries. The recent Intergovernmental Panel on Climate Change (IPCC) report projected an increase in temperature, spatial and temporal variability of precipitation, which may increase water demand but reduce seasonal water supply (Cineros et al. 2014). Climatic behavior prediction is one of the challenging tasks to meteorological society all over the world. Its variability directly influences many sectors such as agriculture, water etc. So it is necessary to determine the relationship among the climatic variables and its influence on these sectors. Climatic variables include rainfall, maximum-minimum temperature and humidity (Surendra H et al. 2014).. 1.3 Urban Water Management in Palestine 1.3.1 History overview Growing competition, conflicts, shortages, waste and degradation of water resources make it imperative to rethink about conventional concepts, in order to shift from an approach that attempts to manage separately the different aspects of urban water cycle to an integrated approach including all stakeholders (Global Water Partnership GWP, 2012). 17 | P a g e © 2016 Tous droits réservés.. lilliad.univ-lille.fr.
(29) Thèse de Fayez El Masri, Lille 1, 2016. The law proposes to establish four public water and wastewater management utilities in Palestine (water governance in Palestine report,2015). Until this can be realized, the current management systems, in which municipalities and village councils will continue to provide water and sanitation services. Most of these councils lack adequate infrastructures, technical skills, and human and financial resource capacity. Current statistics show that 29% of the Palestinian communities (7% of population) are not connected to drinking water. In the areas connected to water supply, 15% of the population is not served. Around 23% of the total population is not supplied with water in the West Bank (PHG, 2003). Despite the fact that the total renewable water resources in the West Bank and Gaza Strip is estimated at 722 Mcm (m3) / year, in the form of groundwater resources (Palestinians are not allocated their rightful shares from surface water), Palestinians are allowed to use only 250 Mcm / year ; the rest is used by Israel. 1.3.2 Current Water Management Models in Palestine In the West Bank, the private sector was not given the opportunity to interfere in the water supply sector, public water utilities; municipal and village councils own and operate the water supply. Water supply management can be grouped into two main categories: Delegated Public Management Model; Direct Public Management Model 1.3.2.1 Delegated Public Management Model In the delegated public management model, the system is built up and operated by a water utility. The water utility also operates the infrastructure as a permanent concessionaire. In this model, water utilities are owned by group of municipalities (shareholders) and thus it is a public organization, although it may be operated on a commercial basis. This model was developed in the West Bank during the time of Jordanian rule prior to 1967. Two major utilities have been established: (i) the Jerusalem Water Undertaking (JWU), which currently runs the water sector in Ramallah and part of Jerusalem Governorates (ii) the Water 18 | P a g e © 2016 Tous droits réservés.. lilliad.univ-lille.fr.
(30) Thèse de Fayez El Masri, Lille 1, 2016. Supply and Sewage Authority (WSSA), which runs the water supply and sanitation sector in the Bethlehem Governorate. 1.3.2.2 Direct Public Management Model In the direct management model, municipalities or villages councils manage the water services. Municipalities are responsible for funding the current investment and capital cost, the capital investments are almost funded by external financial aids (national or international development agencies). Municipalities are the owners and operators of the infrastructure. Direct public management is the dominant management mode in Palestine. Both public models are functional in Palestine but the first model is more efficient as it is able to provide better services (water governance in Palestine report,2015). The delegated public management is more autonomous; it has more technical capacity and runs on a cost recovery basis for the provided services. Efficiency is lower with the direct public management model, the customer base is smaller in general, and most of the municipal and village councils do not have a separate division to run the water service. Budgets are not differentiated among the various provided services or the collected revenue. It is difficult for this management model to be run on a sustainable basis. Development in the infrastructure needs financial support from external sources; this is also the case in the first model, though to a lesser degree. Donor agencies provide funds as grants and loans, especially the World Bank and the European Investment Bank. Although such loans are soft and long term, they increase the national debt.. 1.4 Use of Artificial Neural Networks in Urban Water Management An Artificial Neural Network (ANN) constitutes a powerful tool for modeling complex processes. It establishes relations between the cause (input data) and the result (output data) of a process without a need for making assumptions considering the nature of the process. Applications of ANN are widespread and vary from optimization of measuring networks, operational water management, prediction of drinking water consumption, on-line steering of wastewater 19 | P a g e © 2016 Tous droits réservés.. lilliad.univ-lille.fr.
(31) Thèse de Fayez El Masri, Lille 1, 2016. treatment plants and sewage systems. Where processes are complex, neural networks can open new possibilities for understanding and modelling these kinds of complex processes. The use of ANN in water management increases rapidly, several applications of ANN in water resources engineering have been reported (Schulze FH et al, 2005). Various Artificial Neural Network techniques such as Generalized Regression Neural Networks (GRNN), Feed Forward Neural Networks (FFNN) and Radial Basis Neural Networks (RBNN) have been evaluated based on their performances in monthly forecasting of water consumptions from several factors (Seth and Indranil, 2015).. 1.5 Conclusion This chapter presented a literature survey of the urban water demand management; this issue is one of the main important concerns for policy makers in order to establish strategies for investment in water infrastructures, particularly for countries suffering from high water stress such as Palestine. This review showed different studies were conducted on factors affecting the water consumption. The previous results discussed in this chapter will be used again in the following chapters in order to analyze the water demand management in Palestine throughout field studies in two cities in Palestine. The previous studies showed that the water demand is influenced by several factors, such as the household size, the family income, the age of family members, the level of education, the area of the building and the climate factors. The influence of each factor on water consumption was analyzed. In some cases, the influence is clear and could be used for planning. In other cases, the influence is not clear, because it could be interconnected with other influencing factors. The chapter presented also the water management in Palestine. This issue is complex, because of the high influence of the occupation on the water management, particularly for the water resources management. The situation is still critical and requires urgent intervention to prevent the catastrophic lack of water for the Palestinian population, in particular in Gaza. 20 | P a g e © 2016 Tous droits réservés.. lilliad.univ-lille.fr.
(32) Thèse de Fayez El Masri, Lille 1, 2016. The use of Artificial Neural Networks (ANN) in urban water management was presented; this powerful tool specialized in modeling complex phenomena will be used in this research for the water demand analysis in two Palestinian cities. In the following chapters, the cities used in this research will be presented successively, the water demand analysis in these cities will be shown and finally the ANN will be used to model the water demand in these cities.. 21 | P a g e © 2016 Tous droits réservés.. lilliad.univ-lille.fr.
(33) Thèse de Fayez El Masri, Lille 1, 2016. 2 Description of the Cases Study Areas: Cities of Ramallah and Khan Younis 2.1 Introduction This study aims at developing tools, understanding and strategy for the water policy in urban area in Palestine. The use of water in urban area constitutes a strategic issue for Palestinian Authority. In order to analyze this use and to understand its drivers as well as barriers, field studies were conducted in two cities in Palestine. The first city is Ramallah, which is located in the West Bank of Jordan and considered as the administrative center of the Palestinian authority. The second city is Khan Younis, which represents the Gaza strip, it is known for the high population density, the poor economical and environmental conditions and the lack of water resources. In this chapter, a detailed presentation of these cities will be discussed, in particular the environmental conditions, the socio-economic context as well as the water resources and infrastructures.. 2.2 Water issue in Palestine 2.2.1 Palestine’s Profile Palestine is located in Western Asia between the Mediterranean Sea and the Jordan River. The State of Palestine claims the West Bank and Gaza Strip, with eastern Jerusalem as the designated capital with total area of 6,220 km². Since 1994, the Palestinian Authority assumes a partial control of these areas. The Palestinian Authority applied for United Nations (UN) membership in 2011. In 2012 it was granted a non-member observer state status. Situated at a strategic location, the region has a long and tumultuous history as a crossroads for religion, culture, commerce and politics (UN Report 2014).. 22 | P a g e © 2016 Tous droits réservés.. lilliad.univ-lille.fr.
Figure


+7


Documents relatifs
Moreover, wind drives freshwater input from the Rhoˆne river plume on certain occasions and is also responsible for the dispersal of the local inflows from the Caronte channel and
Due to the flood irrigation method used in the site, which induces irregular pattern of soil moisture both in space and time, the comparison between scintillometer-based estimates
Abstract: The SISE‐Eaux database of water intended for human consumption, archived by
Despite the relatively weak local transports due to geothermal heating (Figs. 6 and 7), its peak transformation rate of 25.5 Sv at g 5 28.11 kg m 23 is of comparable magnitude to
The impact of the temporal resolution on the model accuracy is evaluated by computing the pumped flow rate from the PVWPS model for different temporal resolutions of
Forecast and error distribution of the ARMA model for the residence A: on the left, the data (in black), the forecasts of the mean, the PG model and our ARMA model (in blue)
De sorte que le reflet de la croix est à présent le comparé d’un nouveau comparant qui correspond au dernier vers, lui aussi entre parenthèses : (Puntos suspensivos).
This study therefore aims to (1) assess the water footprint of ten staple crops for food, feed and fuel production in Thailand by considering the country-wide scale; and
