O
pen
A
rchive
T
OULOUSE
A
rchive
O
uverte (
OATAO
)
OATAO is an open access repository that collects the work of Toulouse researchers and
makes it freely available over the web where possible.
This is an author-deposited version published in :
http://oatao.univ-toulouse.fr/
Eprints ID : 16428
To cite this version : Targetti, Stefano and Viaggi, Davide and
Cuming, David and Sarthou, Jean-Pierre and Choisis, Jean Philippe
Assessing the costs of measuring biodiversity: methodological and
empirical issues. (2010) In: 120th European Association of
Agricultural Economists Seminar - EAAE, 2 September 2010 - 4
September 2010 (Chania, Greece).
Any correspondance concerning this service should be sent to the repository
administrator:
[email protected]
Assessing the costs of measuring biodiversity: methodological
and empirical issues
Targetti S.a, Viaggi D.a, Cuming D.a, Sarthou J.P.b, Choisis J.P.b
a: DEIAgra - Department of Agricultural Economics and Engineering, University of Bologna. Viale Fanin 50 40127 Bologna - Italy.
b: UMR Dynafor - INRA-INP/ENSAT, Chemin de Borde Rouge, 31326 Castanet Tolosan – France. Keywords - biodiversity measurement, research costs.
Abstract - Organic and low-input farming practices are considered keystones for the conservation of biodiversity in
semi-natural systems. Accordingly, attention to the assessment of the benefits stemming from these activities is increasing in order to provide a solid base for the adoption of agro-environmental incentives and to support their monitoring and evaluation.
The evaluation of the positive effects of organic and low-input farming activities on biodiversity is limited mainly by: the difficulty in proposing simple and widely-applicable indicators of biodiversity, and the substantial lack of data concerning the costs of measuring biodiversity - an essential element for a cost-effectiveness analysis.
Moreover, the limited scientific literature available is based on ex-post analysis rather than on systematic data collection.
The assessment of the costs of measuring biodiversity at farm-scale throughout Europe is one of the specific tasks of the BioBio project (UE-FP7). In this work, we discuss methodological aspects and preliminary results based on data gathered during fieldwork measurements of biodiversity in BioBio.
1 Introduction
EU agricultural policy is increasingly incorporating environmental objectives and promoting streams of policy tools directly aimed at generating environmental benefits.
A well known, but still largely unresolved, problem is related to the improvement of the design of such policies in order to take better account of the environmental benefits produced. In spite of a large body of literature on environmental indicators, this topic remains largely unmeasured (see Finn et al., 2009 for a discussion about the difficulties in measuring and assessing policy impacts).
However, the EU Commission is focusing more attention on policy evaluation, including the development of appropriate indicators. This particularly targets pillar II measures (rural development) including, among other issues, biodiversity (European Commission, 2006).
The relevance of measuring environmental indicators in relation to policy can be seen at different stages of the policy cycle. Ex ante, it is relevant to have a clear idea of the environmental context in the target area and to use such information to design appropriate policy targets. Ex post, it is relevant to identify the effects that a policy has generated, by analyzing changes in indicators due to policy effects. Finally, the measurement of indicators could support the implementation of policy instruments in which policy payments to farmers are a function of the amount of environmental services produced (Cooper et al., 2010). In all cases, a specific problem is to identify indicators which are rigorous enough to allow an for assessment of the differences between alternative production techniques, e.g. conventional vs. organic. Three main research issues arise around these policy needs:
• the identification of appropriate indicators;
• the establishment of appropriate procedures for using such indicators in the elicitation of differential effects of policy on indicator measures;
• Assessment of costs and benefits from indicator measurement.
Among the above problems, one very basic issue generally not addressed in the economic literature, is the cost involved in the measurement of indicators. As long as managing authorities have budget constraints and costs are connected with the information property and the policy usability of the indicators, the issue of the cost of measurement is connected to the issues identified above.
The availability of data concerning the cost of measurement of biodiversity indicators is of great importance both for the implementation of sound agro-environmental schemes based on reliable information and for the optimization of funds for biodiversity monitoring and conservation (Ferraro and Pattanayak, 2010). Nevertheless, the cost-effectiveness of biodiversity measurement is a practically unstudied issue and only a few examples exist which propose a methodological approach to the cost of assessing biodiversity measurement. To our knowledge, no papers exist on the cost analysis of the measurement of biodiversity and the comparison of such costs between organic and conventional farms.
The assessment of the costs of measuring biodiversity is one of the specific tasks of the BioBio project (Indicators for biodiversity in organic and low-input farming systems -EU-FP7- http://www.biobio-indicator.wur.nl). The BioBio project involves 12 case studies (CS) throughout Europe and 3 CS in extra-UE countries concerning organic (or low input) and conventional agricultural systems.
In this paper we propose a methodology for the cost assessment of biodiversity measurement and discuss its practical application to the spider and earthworm indicators measured through the BioBio project protocol. The analysis is based on preliminary data from 4 farms in the French CS, located in the Gascony Hills and Valleys and straddling the Gers and Haute-Garonne Departments, in a sub-Mediterranean climate. All the farms surveyed are in arable farming systems, without animal husbandry. The results are organised in two sections: the cost assessment of the efforts of the research unit (research cost) and the hypothetical cost charged by a biodiversity monitoring agency (standard cost).
This work begins with a general description of the problem of costs and benefits of the indicators and a brief review of the literature on the cost-effectiveness analysis of biodiversity measurement in section 2. Section 3 focuses on the methodological approach followed in the assessment of costs of the paper's case study and the protocol for the measurement of the indicators. Section 4 focuses on the cost assessment results (research and standard costs) and section 5 provides a discussion of results and conclusions.
2 Background
The problem of the costs and benefits involved in the measurement of biodiversity indicators can be analyzed in economic terms in light of the theoretical framework provided by the economics of information (Hirshleifer and Riley, 1992).
Costs are the value of resources consumed to undertake some activity, in this case gathering of information. They can be estimated directly based on direct information collection concerning resource use and the unitary cost. Cost categories can be identified from the cost literature (e.g. Chambers, 1988, ch. 2).
Benefits can be interpreted as benefits of change in knowledge due to the information collected, which can be interpreted as the difference between the expected profit (social benefits) of informed and uninformed actions. Some analytical treatment of the problem is provided by Hirshleifer and Riley (1992, ch. 5).
In spite of the significant amount of literature available on indicators, the number of papers focusing on the issue of the costs and benefits of indicator measurement is particularly limited, even though the feasibility and cost-effectiveness of sampling methods are among the key attributes acknowledged to be good indicators of biodiversity (OECD, 2001).
Few examples exist in the literature directly concerning the cost assessment of biodiversity measurement. Balmford and Gaston, (1999) estimated in 100 person-years (corresponding to US$ 1 million) the effort spent to survey five species (taxa) indicators in 15000 km2 of forests in Uganda.
Qi et al. (2008) undertook a study of cost-efficacy in measuring farmland diversity based on operational data from the vast Farm Scale Evaluations (FSEs) of genetically modified crops project undertaken in the United Kingdom starting in 2000. The FSEs were funded by the UK Department of the Environment, Food and Rural Affairs (Defra) and cost £6 million. Specifically, Qi et al. analysed the operational data from the FSEs to determine the financial and time related costs of the study’s 14 protocols (i.e. field layout, seedbank, follow-up seedbank, crop assessment, weeds within fields, follow-up weeds within fields, weeds in field margins, weed seed rain within field, bees and butterflies, insects on crops, epigeal and aerial arthropods, soil surface invertebrates, gastropods within fields, gastropods in field margins). 113 of the total 266 experimental sites were analysed. In their cost analysis, the authors focused on the direct costs of the ecological measurement protocols used in the FSEs and in so doing, excluded the government and industry costs involved in establishing the project. This enables application of the study to future scale ecological studies with varying forms of cost structure.
The resulting cost was between £217 and £4548 per site depending on the protocol adopted.
Gardner et al. (2008) compared costs and benefits of different indicators of biodiversity in the Amazonian Forest with the aim of identifying “high performance indicators”. These are meant to be species or groups of species that combine feasibility (in terms of survey efforts) and ecological value or, in other words, that “maximise the amount of information returned for any given investment”. The authors considered standardized costs for equipment, workers' salaries, transport costs and accommodation and the analysis was split between field and laboratory work. Surprisingly, the analysis pointed out that, from an ecological point of view, the inexpensive indicators were often the most effective. The authors concluded that biodiversity conservation and decision-making could gain significant benefits from a local-designed cost-effectiveness analysis.
Franco et al. (2007) proposed a sub-sampling method able to compare the effort-effectiveness of different techniques for the assessment of biodiversity. In doing so, the authors proposed a reliable method for comparing cost (effort) and ecological effectiveness of different indicators.
Cantarello and Newton (2008) sought to identify cost-effective indicators and evaluate suitability for evaluating conservation status of forested habitats.
It is important to note that only the two last examples implemented the on-field gathering of effort data, whereas the other works were based on indirect cost assessments.
3 Methodology
The main categories of expenditure attached to the measurement of biodiversity indicators were the following:
• Labour • Equipment • Travel • Consumables
• Others (e.g. Income forgone if the test requires damaging some production).
Each category considers specific resources and unitary costs and data collection was organised in order to retrace the costs related to each day of the survey, each single farm and each single indicator.
The cost assessment methodology was organised in such a way as to allow for an analytical assessment of actual costs, as well as the subsequent simulation of costs with standardised costs. For this reason both physical units of resources used and related prices were collected on a regular basis.
An important point is the need to distinguish fixed costs from variable costs. Fixed costs in economics are usually those that do not depend on the quantity of a good produced by a production unit. In our case, fixed costs are those that do not vary with the “quantity of measures” performed. For example, some cost items can be fixed with respect to:
• Several indicators measured: e.g. a transport expense may serve an inspection at a given site for the collection of data for several indicators;
• Several data collections for the same indicators (e.g. the initial planning of the sampling/transects);
• Several analyses for the same indicator (e.g. the cost of machinery for laboratory analysis, purchased at the beginning and used several times).
Data collection was performed through the gathering of records related to staff time, distance and duration of transport, consumables and equipment. Time spent (and costs) for fieldwork organisation and preparation and taxonomy identification is not included in the present work. Field staff filled in a weekly cost-form which was entered into a relational data-base. Each record contained the following information: date, identification of farm site, staff qualification level, time spent per field worker and was linked to different tables indicating the salary band of staff, the distance of the farm site from the research centre, transport time, equipment and consumable costs, and the type of work (fieldwork, laboratory, etc.). The cost of the indicator measurement was composed of three resource categories: 1) equipment and consumables, 2) labour time investment (fieldwork, laboratory-work and transport), 3) worker categories (researcher, PhD students, temporary workers, etc.).
The cost assessment was applied to the field measurement of the spider (SP) and the earthworm (EW) biodiversity indicators of the BioBio project protocol. The survey concerns the measurement of biodiversity at farm-scale with a selected set of indicators and the quantification of the benefits of organic agriculture on biodiversity. Cost data for the measurement efforts are gathered on a weekly basis by the research units and stored in a relational data-base
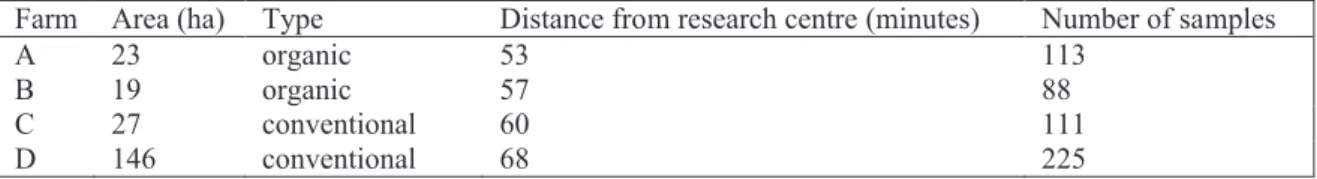
Data covers 4 arable farms in the French CS –Midi-Pyrénées Region (Table 1), where wheat and sunflower are the main crops. The distance from the research centre (driving time in minutes) was similar for each farm (about 1 hour). Survey stratification was performed through the habitat mapping technique in order to adapt the sampling activity to the different habitat conditions of the surveyed farm sites (for further details see Jongman and Bunce, 2009). In the aggregate, 537 samples (345 for SP and 192 for EW) were gathered during the spring 2010 sessions.
Spider sampling was carried out with the aid of a modified vacuum shredder (Stihl SH 86-D), and 5 suction samples were taken on each plot (each suction had a suction area of 0.1 m² and lasted 30 seconds). The samples were . sorted (i.e. separate spiders from other material such soil or organic litter) and placed in vials with 70% alcohol during the fieldwork (Schmidt and Tscharntke, 2005; Schimdt-Entling and Dobeli, 2009). Three survey sessions were scheduled in the project protocol. Here we present data from the first session. The protocol of measurement considered a sampling team of 3-4 persons.
Earthworm sampling was carried out following two methods: 1) mixing an allyl-isothiocyanate and ethanol solution into wood frames (30 cm x 30 cm x 20 cm) which were placed in the ground, and collecting the earthworms that came upward during the first 20 minutes; 2) extracting the soil core (20 cm depth) from the sampling site and hand-sorting the earthworms on a plastic sheet (both methods were performed in each plot). Samples were placed in cold containers with formalin and transferred to refrigerators in the laboratory (Zaborski, 2003; Pelosi et al., 2009). The measurement protocol assumed a sampling team of 5 persons.
Equipment and consumables included all the materials used during the fieldwork as well as the field lunches for the staff. The cost of the vacuum shredder was calculated as: Cost per Suction = cost of the vacuum new / number of suctions over its lifetime. This was approximated to €0.038 per suction. The gross salary of the staff was approximated to €36 per hour for skilled workers (researchers) and €13.8 per hour for unskilled workers (temporary workers, PhD students, see Table 2). Vehicle costs were charged at €0.32 per km and included fuel, car insurance and vehicle depreciation.
At this stage we assumed only the habitat mapping stratification as a fixed cost which we estimated at €800 per farm for the French CS (€400 per indicator1). To avoid distortions the number of persons per team was standardised as specified in the indicator protocols (3 persons for SP, 5 persons for EW) and the number of trips to farms was consequently optimized assuming 8 hours of work per day. The ratio of skilled vs. unskilled workers per team was assessed through real data gathered during fieldworks (see Table 5).
Table 1. Main features of the 4 farms studied and number of samples (SP + EW) gathered during the spring fieldwork.
Farm Area (ha) Type Distance from research centre (minutes) Number of samples
A 23 organic 53 113
B 19 organic 57 88
C 27 conventional 60 111
D 146 conventional 68 225
For the analysis of standard costs we employed two salary bands: €21942 and €36411 year-1 for unskilled and skilled workers respectively (salary band 6 and 9 as defined by the Biotechnology and Biological Sciences Research Council of the UK, 2002; see Qi et al., 2008). The yearly salary was converted into an hourly cost per person assuming 210 working days in a year and 8 working hours per day.
All costs are related to 2010.
Table 2 – Unitary costs employed in the analysis: costs of the research case study (real costs) and costs of a hypothetical monitoring agency (standard costs).
Resource real costs standard costs Skilled worker (€ h-1) 36 22
Unskilled worker (€ h-1) 13,8 13
vehicle (€ km-1) 0,32 0,32
1 The cost of €400 per farm should not be attributed only to spider and earthworm indicators because the habitat mapping stratification is also used for other indicators and several biodiversity indicators can be calculated directly from the mapping in the BioBio protocol. In this preliminary analysis we considered the effect of fixed costs on the only two available indicators.
4 Results
4.1 Assessment of research costs: a case study
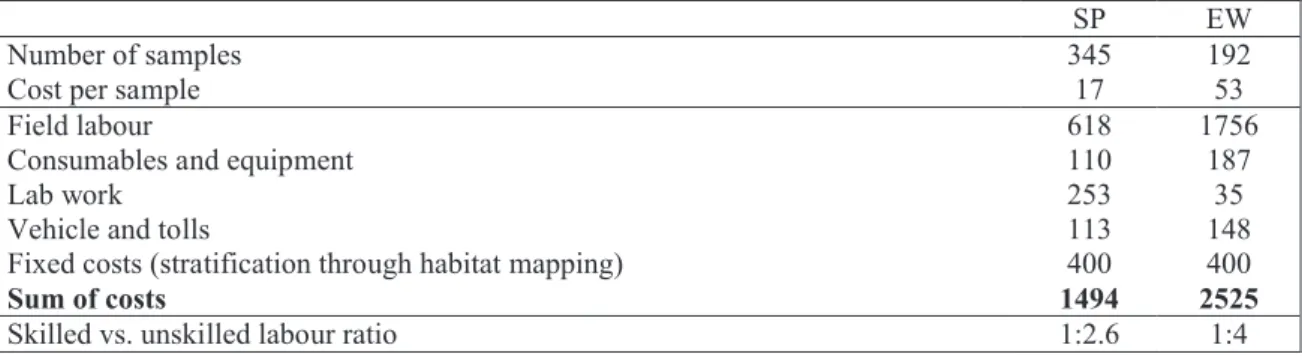
The mean cost of the assessment of biodiversity in the four farms studied was clearly related with the indicator: total cost per farm for the EW indicator was almost two times higher than the SP indicator (Table 3). The difference between the two indicators is more evident considering the cost per sample which was about 3.5 times higher for EW indicator in comparison to SP indicator.
Although the spider indicator required a higher skilled work effort (1 hour of skilled work for every 2.6 hours of unskilled work for SP vs. 1 hour of skilled work for every 4 hours of unskilled work for EW), the field labour cost per farm was higher for the EW indicator (€618 for SP vs. €1756 for EW).
The highest load of costs was field-labour: 41% of total cost for SP and 70% for EW. A considerable portion of total costs was also represented by the fixed costs (€400 per farm estimated for the habitat mapping stratification of survey which count for 27 and 16% on total costs for SP and EW indicators respectively). The portion of the other costs were always considerably lower (max. 10% of total costs), except for laboratory work which constituted an important constituent of costs for the spider indicator (23% of total costs). The employment of a vacuum tool for the SP indicator allowed the gathering of a high number of samples, but this method forced to spend higher efforts for the sorting of species in laboratory in comparison with EW which was organised with a preliminary selection of species during the fieldwork (i.e. earthworms were sorted out to be sent to the taxonomist). The employment of the vacuum tool outweighed the higher costs for the laboratory work because of the high field labour required by the EW protocol: the difference of costs per farm between the two indicators for the laboratory sorting was about €200 higher for SP, whereas the field-work cost per farm was €1138 higher for EW.
Table 3 - Cost assessment of the measurement of biodiversity indicators: number of samples and composition of costs (mean values per farm) for the field measurement of the biodiversity indicators (values are given in €).
SP EW
Number of samples 345 192
Cost per sample 17 53
Field labour 618 1756
Consumables and equipment 110 187
Lab work 253 35
Vehicle and tolls 113 148
Fixed costs (stratification through habitat mapping) 400 400
Sum of costs 1494 2525
Skilled vs. unskilled labour ratio 1:2.6 1:4
The transportation costs (vehicle, highway tolls and work time for transfer of fieldworkers from the research centre) were a considerable portion of costs for the measurement of biodiversity (table 4). This cost was about 25% of total costs for SP and EW. Accordingly, the cost of the measurement of the indicators was strongly tied to the organisation of the fieldwork (number of survey-days, distance of farms from research centre, etc.). The portion of transportation + transfer of fieldworkers with respect to the total costs was slightly higher for SP than for EW (25% vs. 24%). Probably, the organisation of the fieldwork and the number of sampling teams per day for SP was limited by the number of vacuum tools available (2 vacuums in this case-study). Thus, the differences in costs between the two indicators were more evident when considering the effective costs of fieldwork (effective cost = resources spent in field measurement after transport costs): €21 ha-1 for SP vs. €37 ha-1 for EW (ratio 1:1.8) and even more so when considering the effective cost per sample (€13 vs. €42 per sample for SP and EW respectively; ratio 1:3.2).
Table 4 - Analysis of costs of the field measurement of biodiversity (mean values per farm). Share of transportation and transfer of fieldworkers with respect to total costs (mean values per farm) and effective costs of fieldwork (effective costs are: total costs after transport and transfer of fieldworker costs).
Transport costs (vehicle + transfer of fieldworkers, €)
Percentage of total costs (%)
Effective cost per sample (€)
Effective cost per ha (€)
SP 369 25 13 21
EW 618 24 42 37
4.2 Assessment of standardised costs
The cost assessment for the routine measurement of the two biodiversity indicators performed by a monitoring agency is presented in Table 5. The cost of the routine measurement of the SP and EW indicators is €2777 per farm corresponding to €1242 per farm lower than the effective cost of the research unit (30% lower). The comparison of the two indicators points to a higher reduction in costs for the EW indicator (the difference in costs per farm is €500 and €742 lower with standard costs for SP and EW respectively). The reduction in costs for both indicators is due mainly to the exclusion of the fixed costs for mapping stratification through the habitat technique which is €400 per farm (see Table 3). Nevertheless, a significant portion of the cost reduction for the EW indicator is due to the lower unitary costs for the labour of a monitoring agency in comparison with the salary band of the research centre. The cost per sample, and consequently the ratio between the 2 indicators, remains clearly lower for the SP indicator (ratio 1:3 with standard costs vs. 1:3.5 with real costs for EW in comparison with the SP indicator). The gap between the indicators is also highlighted when considering the cost per hectare: €18 ha-1 for SP vs. €33 ha-1 for EW which constitutes a ratio of 1:1.8. The gap per hectare between the two indicators is lower than the cost per sample because of the higher number of samples needed for the SP indicator.
The reduction of transport costs (from €369 to €273 for SP and from €618 to €571 for EW) is mainly linked with the lower salary band considered in the standard assessment which is of high importance in reducing the cost for the transfer of fieldworkers. Nevertheless, the transportation costs (vehicle and transfer of fieldworker team) remain about 30% of the total cost of the biodiversity assessment (27% for SP and 32% for EW).
Table 5 - Cost assessment of the routine measurement of biodiversity indicators: standardised costs for a hypothetic monitoring agency where fixed costs are already paid for and share of transport cost (vehicle + transfer time of fieldworkers) on total costs (mean values per farm).
SP EW
Cost per sample 12 37
Cost per ha 18 33
Field labour 524 1393
Sum of costs 994 1783
Transport costs (vehicle + transfer of fieldworkers, €) 273 571 Share of transfer costs of total costs (%) 27 32 Cost per sample after transfer costs (€) 8 25 Cost per ha after transfer costs (€) 13 22
The high share of field labour on total costs for the measurement of the indicators is also confirmed in the standardised assessment of costs (52% share for SP and 78% share for EW). This evidence highlights a high variability of measurement costs for the SP and EW biodiversity indicators in different countries. For example, considering the salary band for UE-FP7 in Bulgaria which is 6€ h-1, the total cost for SP and EW indicators would be €514 and €513 respectively. Because of the lower labour cost, the reduction of costs between the two biodiversity indicators is clearly different (48% lower for SP, 71% lower for EW). Consequently, the cost of the measurement of the two indicators would be similar at very low salary bands. The comparison of standard costs of biodiversity measurement between organic and conventional
farms highlights a consistently higher effort applied in the field sampling on organic farms (Table 6). Even if the mean number of samples was higher in the conventional farms (84 vs. 50), sampling effort in organic farms was 1.3 times higher concerning the cost per hectare and 1.2 times higher considering the days person-1 ha-1. This is likely due to a higher variability of habitats on the organic farms hence requiring a more intense sampling effort than on the conventional farms. This is confirmed by the higher sampling effort in the organic farms for the farms studied (2.4 vs. 1 samples per ha in conventional farms). It is interesting to note that although the sampling effort per ha is 2.4 times higher, the cost of sampling per ha is only 1.3 times higher on the organic farms. This is likely due to the concentration of collection points for the biodiversity survey on the organic farms.
Results from this preliminary analysis allows the estimation of the effort for the monitoring activity of biodiversity employing the SP and EW indicators; e.g. the sampling on 1% of organic land in Europe (
i.e.
60000 ha; UE data, 2005) can be estimated in 29.6 person-years, corresponding to €1,920,000 withthe salary bands proposed for the routine measurement.
Table 6 - Comparison of standard costs of field sampling in organic and conventional farms. Number of samples, samples ha-1, effective cost ha-1 and effective days person-1 ha-1 of effort required (mean values of Sp + EW sampling per farm, effective cost is: total cost after transport and transfer of fieldworker costs).
Number of samples Samples ha-1
Effective cost ha-1
(€) Effective days per person ha
-1
Organic 50 2.4 32 0,18
Conventional 84 1.0 25 0,15
5 Discussion and conclusions
One of the aims of this study was to emphasise the importance of the assessment of costs in the measurement of biodiversity – an element which is largely ignored in the literature. This is likely the case as this field of research is generally dominated by naturalists and biologists who focus more on the ecological effectiveness of the indicators than on the economic aspects. Although biodiversity indicators were originally proposed to solve the problem of the feasibility (and, hence, the cost) of measurement, the lack of interdisciplinary works in this area has lead to a penury of data, methodologies and papers integrating ecological and economic information for the assessment of biodiversity indicators (Juutinen and Mönkkönen, 2004) and the improvement of environmental policies (Münier et al., 2004; Wätzold et
al., 2005).
The ex-post assessment of costs in the field biodiversity measurement is of significant importance both for the organisation of the sampling sessions, as well as for the cost-effectiveness analysis. The cost assessment could be a valid tool for the optimisation of the use of available resources e.g. for monitoring public programs in agriculture. This evidence is of great importance considering the gap between the need for, and the availability of, funds for biodiversity. In this context, the increased availability of cost data could be of significant assistance in the advancement of the effectiveness of biodiversity assessments. An important result is the relevance of those costs that were in the thousands of Euros, despite the fact that the standard costs of a hypothetical monitoring agency would be considerably lower (this is the case mainly because of the high load of the fixed costs for the habitat stratification that we considered). The costs involved in monitoring biodiversity on organic farms as presented here are merely a preliminary indication as they concern the analysis of the measurement of only two indicators on 2 farms; nevertheless, our work demonstrates that this cost should not be under-evaluated and that a deeper cost-effectiveness analysis is required.
The share of transportation costs (vehicle and transfer time for staff) suggests that a careful organisation of fieldwork should be considered essential for the optimisation of available resources.
This preliminary analysis clearly identified lower costs and a higher number of samples (thanks to the vacuum tool), for the spider indicator. However, this information is incomplete without an assessment of the effectiveness of the measurement. Moreover, the cost of the SP will be much higher given that two further survey sessions are scheduled in the BioBio project protocol. The difference in field labour efforts required by the indicators is not only related to the employment of the vacuum tool, but is likely also related to the more complicated protocol for EW which was performed by way of a double sampling with LATC and by hand.
The high load of labour on the total costs highlights that the results of the cost effectiveness analysis for the measurement of biodiversity is strictly dependent on the cost of labour in different countries. Our preliminary results highlighted that the cost of measurement for SP and EW indicators were equal in countries with lower labour costs; in this case the better indicator should be that with a higher ecological effectiveness. In general, the cost analysis is of great importance and should be taken in consideration when selecting the best indicators. This problem is of significant importance in the selection of a unique set of indicators to be used in the measurement of farm biodiversity in Europe, as the cost effectiveness of the indicators will vary considerably from one country to another.
The choice of indicators with a low cost-effectiveness ratio is valuable in order to reduce the implementation and decision-making costs of policies related to biodiversity. Regular monitoring is the basis of well-designed policy measures (Piorr, 2003) and is therefore an integral part of the costs of policies at different levels: ex ante scientific knowledge for decision-making and ex post monitoring for policy evaluation and improvement. In some cases the employment of complementary methodologies (e.g. multicriteria analysis, expert judgements, etc.) should be considered attentively, as they could be a valid support to the environmental evaluation and capable of reducing the monitoring costs.
We conclude that the measurement of biodiversity at farm level is costly but that the costs may vary considerably between indicators, between organic and conventional farms and between different geographical areas. Some organic farms are structurally (i.e. landscape structure and composition) much more simpler than conventional ones. This criteria should be considered besides the distinction between organic and conventional.
Cost-effectiveness is acknowledged as one of the main future targets of biodiversity assessment in order to enhance the biological results and the social and political acceptance of conservation measures (Millennium Ecosystem Assessment, 2005; Naidoo, 2006). Therefore, the improvement of biodiversity measurement and the identification of a common set of indicators should combine expertise in ecology and economics in order to maximise the limited budgets for conservation of biodiversity and the effectiveness of policies.
Acknowledgements
This work was supported by a grant from UE-FP7, BioBio – Indicators for biodiversity in organic and low input farming systems.
References
Balmford, A. and Gaston, K.J. (1999). Why biodiversity surveys are good value. Nature, Vol. 398, pp. 204-205.
Cantarello, E. and Newton, A.C. (2008). Towards cost-effective indicators to maintain Natura 2000 sites in favourable conservation status. Preliminary results from Cansiglio and New Forest. iForest – Biogeosciences and Forestry, Vol. 1, pp. 75-80.
Chambers, R.G. (1988). Applied production analysis. Cambridge University Press, Cambridge.
Hirshleifer J. and Riley J. G. (1992). The analytics of uncertainty and information. Cambridge University Press, Cambridge.
Cooper, T., Hart K. and Baldock, D. (2010). Provision of public goods through agriculture in the European Union, IEEP-EU Commission, 30-CE-0233091/00-28.
European Commission (2006). Handbook on common monitoring and evaluation framework, Brussels. Ferraro, P.J. and Pattanayak, S.K. (2010). Money for nothing? a call for empirical evaluation of biodiversity conservation investments. Plos Biology, Vol. 4, pp. 482-488.
Finn, J.A., Bartolini, F., Bourke, D., Kurz, I. and Viaggi, D. (2009). Ex post environmental evaluation of agri-environmental schemes using experts’ judgement and multicriteria analysis. Journal of Environmental Planning and Management, Vol. 52, pp. 717–737, ISSN: 0964-0568.
Franco, A.M.A., Palmeirim, J.M. and Sutherland, W.J. (2007). A method for comparing effectiveness of research techniques in conservation and applied ecology. Biological Conservation, Vol. 134, pp. 96-105. Gardner, T.B., Barlow, J., Araujo, I.S., Avila-Pires, T.C., Bonaldo, A.B., Costa, J.E., Esposito, M.C., Ferreira, L.V., Hawes, J., Hernandez, M.I.M., Hoogmoed, M.S., Leite, R.N., Lo-Man-Hung, N.F., Malcolm, J.R.,. Martinus, M.B., Mestre, L.A.M., Miranda-Santos, R., Overal, W.L., Parry, L., Peters, S.L., Ribeiro-Junior, M.A., Da Silva, M.N.F., Da Silva Motta, C. and Peres, C.A. (2008). The cost-effectiveness of biodiversity surveys in tropical forests. Ecology Letters, Vol. 11, pp. 139-150.
Juutinen, A. and Mönkkönen, M. (2004). Testing alternative indicators for biodiversity conservation in old-growth boreal forests: ecology and economics. Ecological Economics, Vol. 50, pp. 35-48.
Jongman, R. and Bunce, R.G.H. (2009). Farmland Features in the European Union. A Description and Pilot Inventory of their Distribution. Alterra report 1936, ALTERRA, Wageningen UR.
Qi, A., Perry, J.N., Pidgeon, J.D., Haylock, L.A. and Brooks, D.R. (2008). Cost-efficacy in measuring farmland biodiversity – lessons from the Farm Scale Evaluations of genetically modified herbicide-tolerant crops. Annals of Applied Biology, Vol. 152, pp. 93–101.
OECD, (2010). OECD expert meeting on agri-biodiversity indicators. Zurich, 5-8 November 2001. Pelosi, C., Bertrand, M., Capowiez, Y., Boizard, H. and Roger-Estrade, J. (2009). Earthworm collection from agricultural fields: comparisons of selected expellants in presence/absence of hand-sorting. European Journal of Soil Biology, Vol. 45, pp. 176-183.
Schmidt-Entling, M.H. and Dobeli, J. (2005). Sown wildflower areas to enhance spiders in arable fields. Agriculture Ecosystems & Environment, Vol. 133, pp. 19-22.
Schmidt, M.H. and Tscharntke, D.T. (2005). The role of perennial habitats for central european farmland spiders. Agriculture Ecosystems & Environment, Vol. 105, pp. 235-242.
Zaborski, E.R. (2003). Allyl isothiocyanate: an alternative chemical expellant for sampling earthworms. Applied Soil Ecology, Vol. 22, pp. 87-95.